
Fear over what could or could not happen at tonight’s FOMC meeting combined with end of month window dressing sent Wall Street into a spin overnight, with stocks losing between 1-2%, taking out European shares as well. Asian futures don’t look good for today’s session as a result. The USD pushed back against most of the majors with Euro losing more than 50 pips alongside Yen which is now almost back to where it was pre-BOJ intervention following its recent meeting. Meanwhile the Australian dollar completely rolled over to get back below the 65 cent level on the risk off mood.
10 year Treasury yields moved nearly 5 points high above the 4.6% level, while oil prices pulled back further from their gapdown over the weekend, with Brent crude down to the $86USD per barrel level. Meanwhile gold was unable to gain any momentum after struggling from last week’s setback to fall below the $2300USD per ounce level.
Looking at markets from yesterday’s session in Asia, where mainland and offshore Chinese share markets are in the same boat with the Shanghai Composite down a handful of points while the Hang Seng Index lifted barely at all, closing just 0.1% higher at 17763 points.
The Hang Seng Index daily chart was starting to look more optimistic with price action bunching up at the 16000 point level before breaking out in the previous session as it tried to make a run for the end of 2023 highs at 17000 points with the downtrend line broken. Price action looks way overextended here so I expect a small retracement back to the 17000 point level shortly:

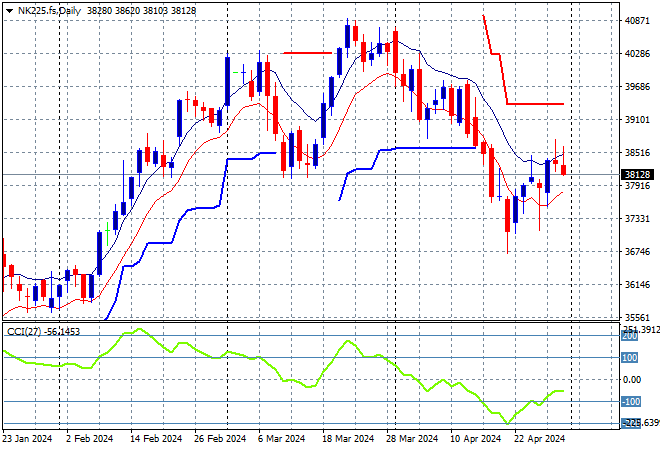
Japanese stock markets reopened from their long weekend with the Nikkei 225 lifting more than 1% at 38405 points.
Price action had been indicating a rounding top on the daily chart with daily momentum retracing away from overbought readings with the breakout last month above the 40000 point level almost in full remission. Short term resistance has been defended with short term price action now retracing to support at the 39000 point level. Watch the 38000 level for signs of a true breakdown:
Australian stocks were the poor performers relatively speaking with the ASX200 up just 0.3% to close at 7664 points.
SPI futures are down at least 1.2% as they still try to catch up to the very high optimism on Wall Street. The daily chart shows a potential bearish head and shoulders pattern forming with ATR daily support now broken, taking price action back to the February support levels. Notably momentum is failing to get out of its oversold condition which is setting up for more downside:

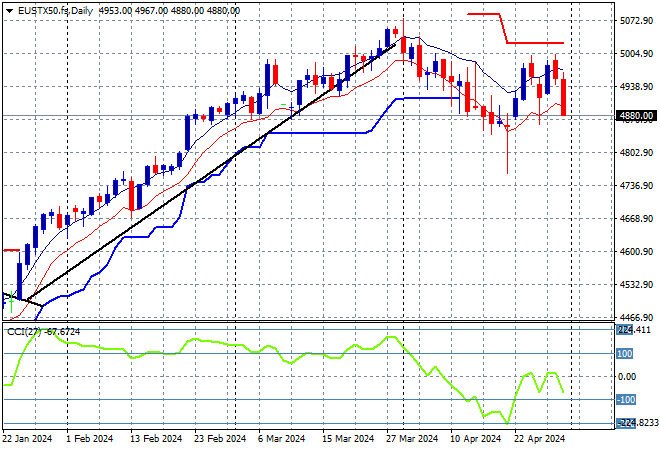
European markets were unable to continue their own rebound with further bad sessions across the continent overnight as the Eurostoxx 50 Index finished more than 1% lower to close at 4921 points.
The daily chart shows price action off trend after breaching the early December 4600 point highs with daily momentum retracing well into an oversold phase. This was looking to turn into a larger breakout but this retracement below short term support is likely to turn into a larger reversal with a clear break of support at the 4900 point level:
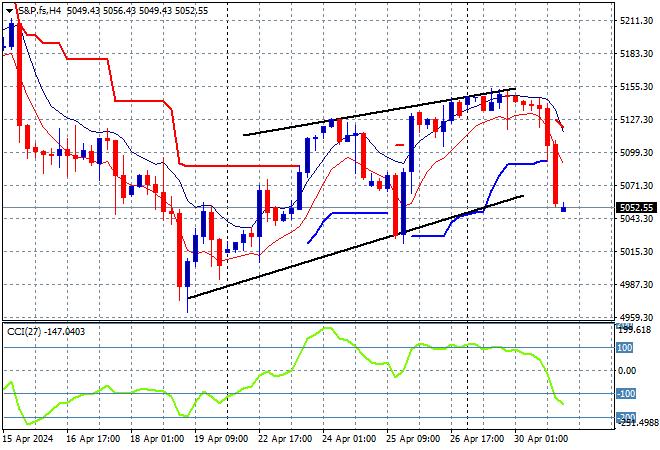
Wall Street ended the month on a very bad note with the NASDAQ losing more than 2% while the S&P500 dropped some 1.7%, closing at 5035 points.
The four hourly chart was showing a fairly wide trend channel forming after bottoming out at support at 5000 points but lost significant momentum following Friday’s rebound, and thus a full retracement through trailing ATR support at the 5100 point level:
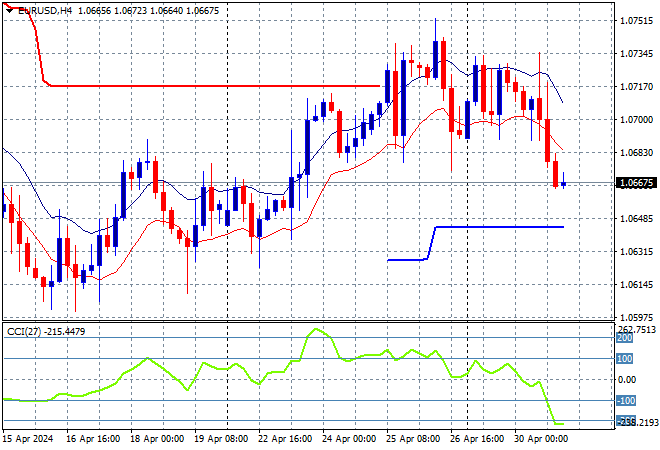
Currency markets have been slowing turning away from King Dollar and had a mild reversal on the GDP and PCE double whammy but this resolved back to USD strength as we await the FOMC meeting tonight. Euro had completed a rounding bottom pattern on the four hourly chart but rolled over last night to take out a week of gains.
The union currency had previously bottomed out at the 1.07 level at the start of April as medium term price action with a reprieving reversal in price action back towards the 1.09 level before last week’s inflation print. Short term support at the 1.0740 has been rejected with medium support at the 1.0630 level next to come under threat:
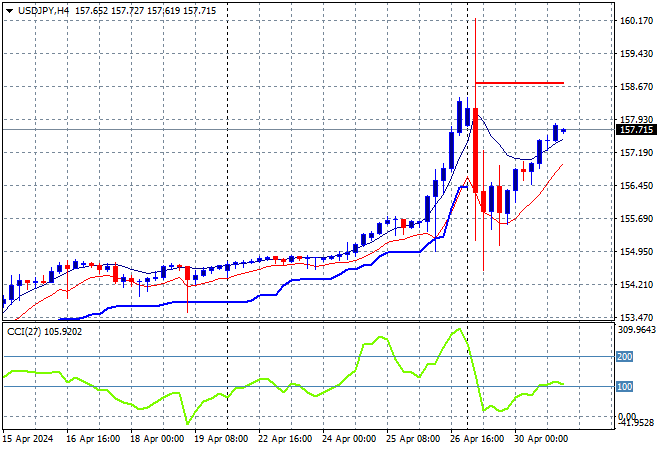
The USDJPY pair is defying the odds, rising again in steady fashion after some BOJ intervention that sent it across a 600 pip range post last week’s meeting. Overnight saw it move again above the 157 handle and almost back to the rocket high highs although momentum is now only slightly overcooked, setting up for further gains:
The Australian dollar rolled over like a dead dog shot by a Republican, falling through the 65 handle after making a new two week high without getting ahead of itself.
The Aussie has been under medium and long term pressure for sometime before the RBA and Fed meetings and while the previous temporary surge looked strong, it wasn’t overbought on the four hourly chart and had not surpassed support from last week’s consolidation phase. With short term support taken out, watch for the 64 handle to come under threat next: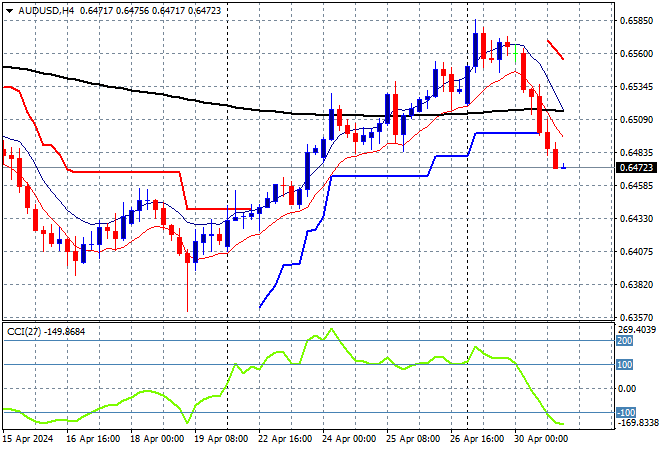
Oil markets have seen increasing intrasession volatility after topping out during the latest round of Middle East conflicts with downside volatility breaking out overnight as Brent crude was pushed below the $86USD per barrel level.
After breaking out above the $83 level last month, price action has stalled above the $90 level awaiting new breakouts as daily momentum waned and then retraced back to neutral settings. Watch daily ATR here carefully which is now broken:

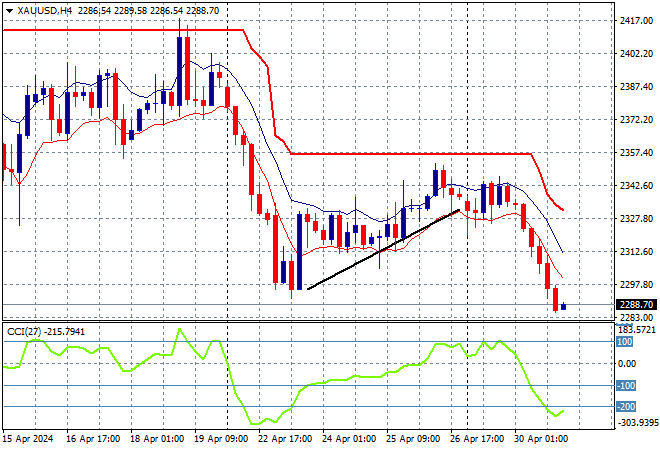
Gold failed to get back on trend after the minor retracement earlier in the month with the failed breakout above the $2400USD per ounce level turning into a correction and now a complete rollover down through the $2300 level overnight.
Support at the $2200 level is now going to be the area to test next as the early April gains disappear and a new monthly low is made:
Glossary of Acronyms and Technical Analysis Terms:
ATR: Average True Range – measures the degree of price volatility averaged over a time period
ATR Support/Resistance: a ratcheting mechanism that follows price below/above a trend, that if breached shows above average volatility
CCI: Commodity Channel Index: a momentum reading that calculates current price away from the statistical mean or “typical” price to indicate overbought (far above the mean) or oversold (far below the mean)
Low/High Moving Average: rolling mean of prices in this case, the low and high for the day/hour which creates a band around the actual price movement
FOMC: Federal Open Market Committee, monthly meeting of Federal Reserve regarding monetary policy (setting interest rates)
DOE: US Department of Energy
Uncle Point: or stop loss point, a level at which you’ve clearly been wrong on your position, so cry uncle and get out/wrong on your position, so cry uncle and get out!