
Friday night saw the release of the latest US unemployment numbers, which came in softer than expected as headline unemployment rose. While the already soft USD continued to dive on the print, equity markets lost confidence with Wall Street selling off across the board. Futures are indicating a sour start to the trading week here in Asia for stock markets while the Australian dollar has held above the 66 cent level for a new monthly high alongside a firming Euro that almost pushed through the 1.10 level.
10 year Treasury yields slipped, finishing just above the 4% level, while commodities saw a mixed result, with Brent crude again unable to push through the $83USD per barrel level while gold can’t be stopped above the $2100USD per ounce level.
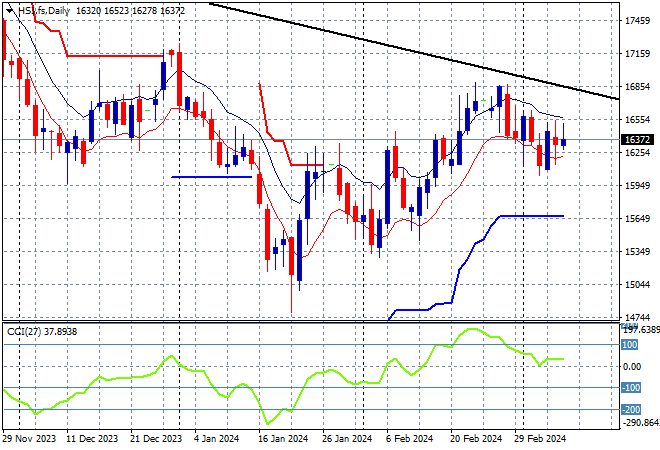
Looking at markets from Friday’s session here in Asia, where mainland and offshore Chinese share markets were rising together again with the Shanghai Composite up more than 0.4% while the Hang Seng advanced more than 1.5% before closing a modest 0.7% higher at 16356 points.
The daily chart was starting to look more optimistic with price action bunching up at the 16000 point level, ready to possibly make a run for the end of 2023 highs at 17000 but as I warned previously, watch for any retracement down to the low moving average that could presage a full breakdown to the long term trend:
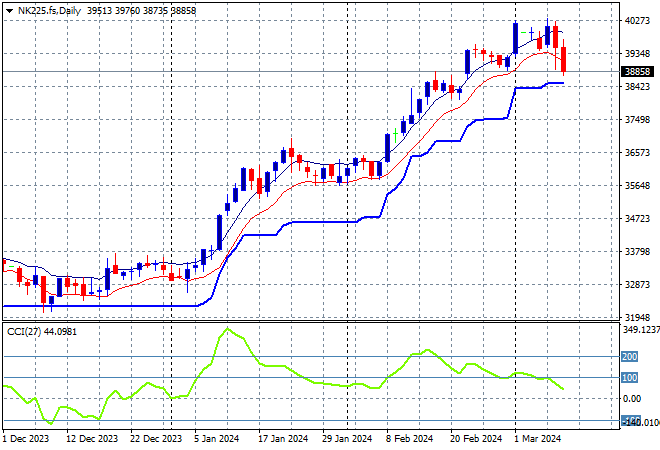
Japanese stock markets were able to rebound ever so slightly, with the Nikkei 225 closing just 0.2% higher at 39689 points.
Trailing ATR daily support was never threatened by price action after this bounce went beyond the September highs at the 33000 point level with daily momentum getting back to overbought readings with a significant breakout. A selloff back to ATR support at 38000 points remains unlikely as the November highs are wiped out in this breakout but I’m cautious of a strong pullback here on any volatility, with futures not looking promising this morning:
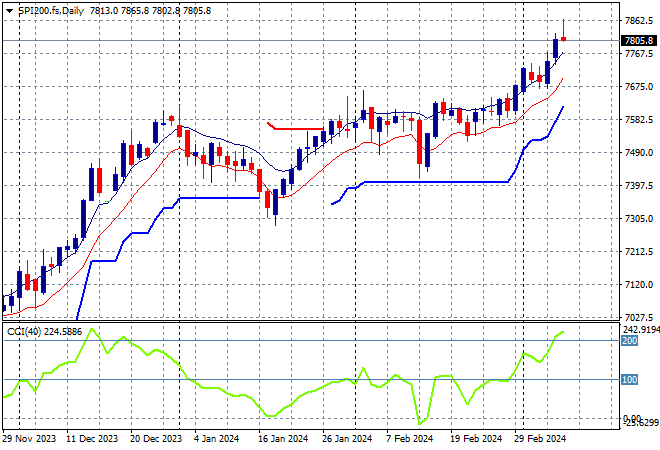
Australian stocks were nearly the strongest again with the ASX200 gaining more than 1% to close at 7847 points.
SPI futures are down at least 0.6% given the poor showing on Wall Street from Friday night. The daily chart was looking firmer with the medium term uptrend and short term price action coming together to take out the previous December highs. As I said previously, watching for any continued dip below the low moving average could see a significant pullback but watch ATR support which has been defended so far:
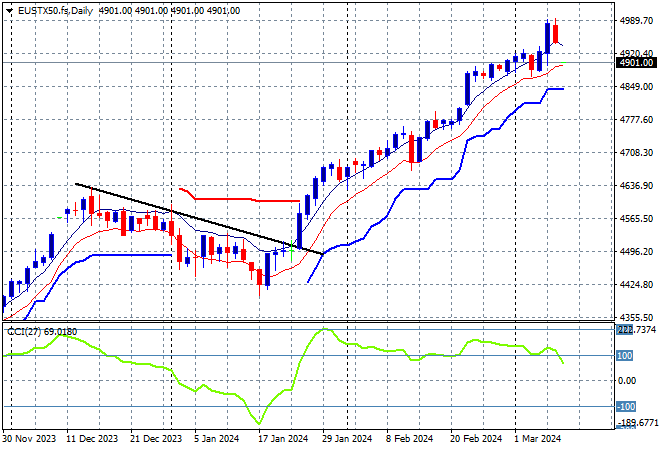
European markets were a bit hesitant in their final session of the trading week with small losses the continent with the Eurostoxx 50 Index finishing nearly 0.3% lower at 4961 points.
The daily chart shows price action still on trend after breaching the early December 4600 point highs but daily momentum is almost out of overbought phase. This is looking to turn into a larger breakout but watch for any falls below the low moving average or ATR support proper:
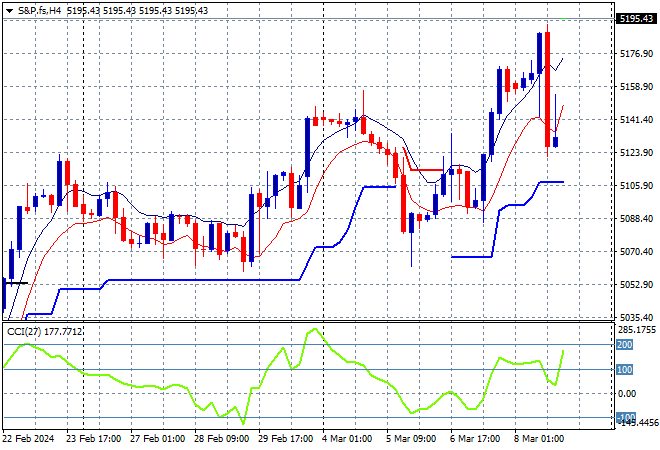
Wall Street did not like the NFP print with losses across the board, the NASDAQ losing more than 1% while the S&P500 finished 0.6% lower at 5123 points.
The four hourly chart shows a false breakout just before the print that only took out about half of the week’s advances, so not all is lost. Price is still being strongly supported above the 5050 point level with short term momentum firm above 5100 points:
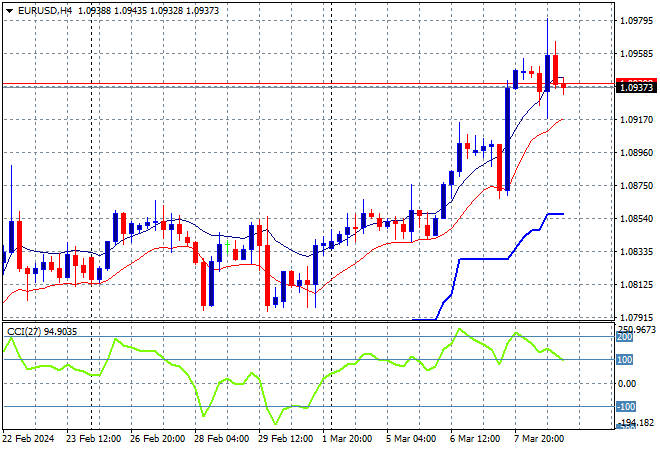
Currency markets were already fully into anti USD mode prior to the US jobs print on Friday night and post the ECB’s hold decision with the DXY Index pushed down another 0.5%, giving Euro more life and a breakout that saw it nearly push through the 1.10 level.
The union currency has made another new monthly high with a view to getting back to the 1.09 handle as momentum remains overbought in the short term and price action breaking out nicely. Watch for any pullback to the 1.0820 level and any test of the 1.08 handle itself however on a reversion:
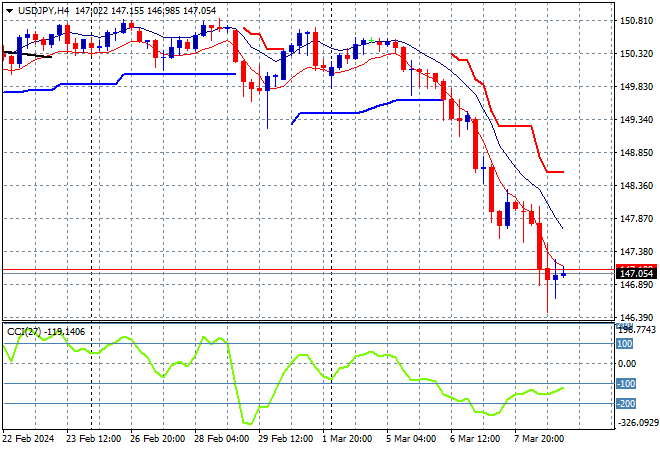
The USDJPY pair remains the most volatile after being the most stable for several weeks as it continued its breakdown that saw it briefly cross below the 147 level and finish there on Friday night in response to the NFP print and broader softer USD trend.
The medium term picture was looking very optimistic as Yen sold off due to BOJ meanderings but momentum is obviously very negative as Yen buyers step in but watch for a potential violent upswing through the mid 148 level:
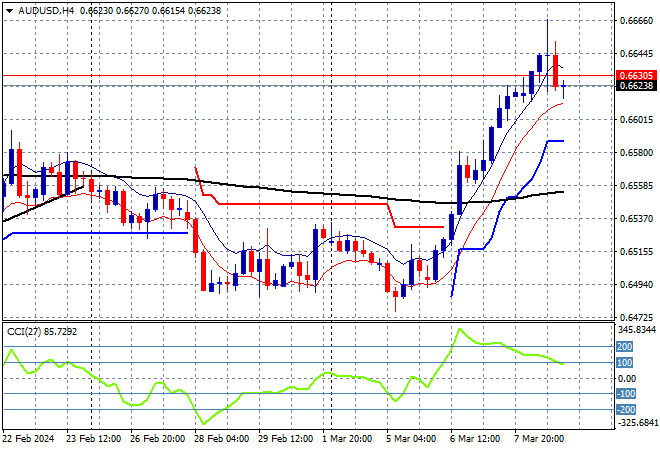
The Australian dollar was able to continue its own strong bounce back to remain above the 66 handle as it finally surpassed the early February highs but there was a wobble later in the session that could translate into a pullback on the weekend gap.
The Aussie has been under medium and long term pressure for sometime with the short term moves above the 65 level unable to set up for another breakout with short term momentum really painting the picture of internal weakness here. Watch for any signs of a break below the four hourly low moving average presaging a return to last week’s low:
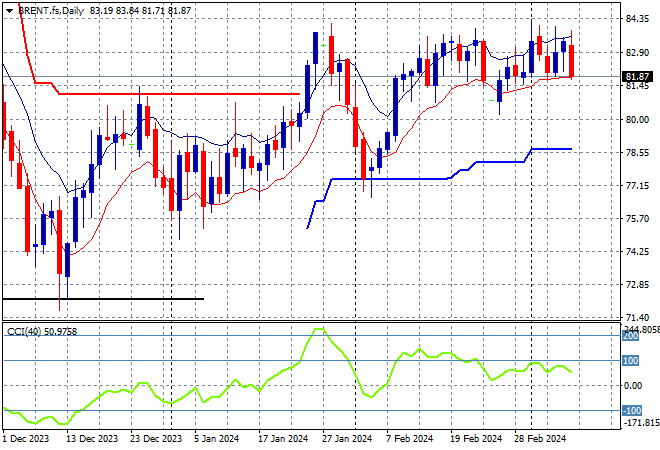
Oil markets are still failing to regain their December highs with Brent crude again stuck below the recent weekly highs at the $82USD per barrel level as it continues to come up against weekly resistance.
After retracing down to trailing ATR daily support at the $77 level, price is still above the weekly resistance levels that so far have held from the January false breakout with the short term target the late January highs above $84 still the next target:
Gold is still moving higher after some recent deceleration but really wants to keep punching through the $2100USD per ounce level, closing just below the $2180 level on Friday night with almost no reaction to the NFP print.
Last week daily momentum was nearly off the charts – never a good sign – with short term support at the $2000 level turning to what could be rock solid medium term support but still the critical area to watch ahead on a likely pullback due to excessive volatility. So far however the four hourly chart looks stable:

Glossary of Acronyms and Technical Analysis Terms:
ATR: Average True Range – measures the degree of price volatility averaged over a time period
ATR Support/Resistance: a ratcheting mechanism that follows price below/above a trend, that if breached shows above average volatility
CCI: Commodity Channel Index: a momentum reading that calculates current price away from the statistical mean or “typical” price to indicate overbought (far above the mean) or oversold (far below the mean)
Low/High Moving Average: rolling mean of prices in this case, the low and high for the day/hour which creates a band around the actual price movement
FOMC: Federal Open Market Committee, monthly meeting of Federal Reserve regarding monetary policy (setting interest rates)
DOE: US Department of Energy
Uncle Point: or stop loss point, a level at which you’ve clearly been wrong on your position, so cry uncle and get out/wrong on your position, so cry uncle and get out!