
September’s house price results released by CoreLogic revealed that dwelling values across the five major capital city markets declined at the sharpest quarterly pace (-4.4%) since January 1983:
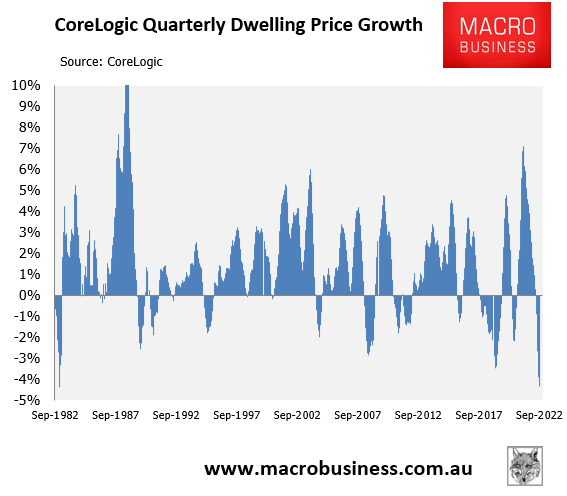
Sharpest quarterly decline in dwelling values since January 1983.
The next chart plots the quarterly price changes across the five major capitals, and shows that the ‘Big three’ led the correction over the September quarter, with Sydney (-6.1%), Melbourne (-3.7%) and Brisbane (-4.4%) all registering sharp price falls:
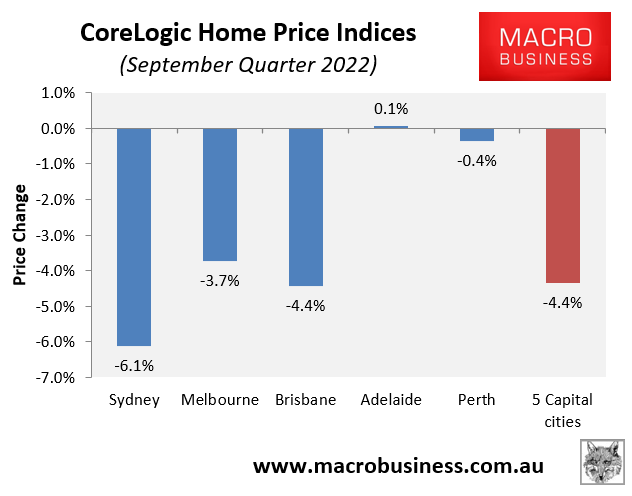
‘Big three’ capitals drive price falls
The next chart plots the current 5-city aggregate dwelling correction (black line) against prior episodes, using the CoreLogic monthly hedonic index dating back to 1980:
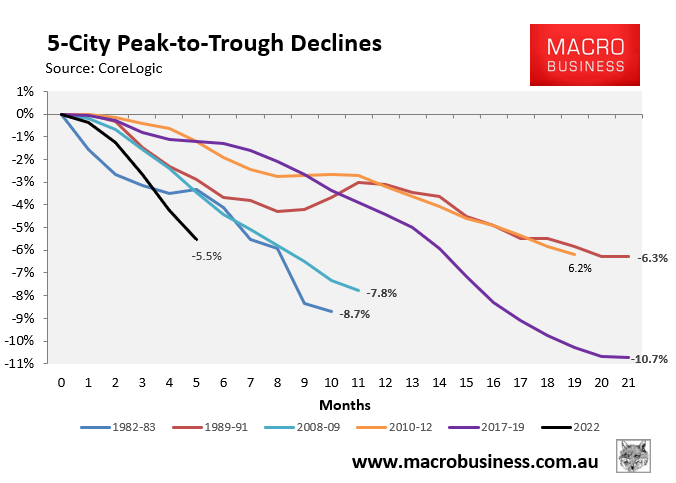
Sharpest housing correction on record.
While the current correction of 5.5% over five months at the 5-city aggregate level is smaller than the corrections of 2017-19 (10.7% over 21 months) or 1982-83 (8.7% 10 months), it is easily the fastest decline at this stage of the cycle on record.
Finally, the next chart plots the declines from peak across the five major capital cities as at 30 September:
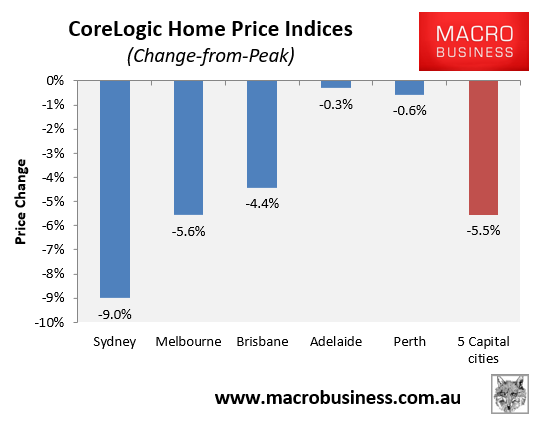
Sydney house prices crashing.
Sydney’s 9.0% decline is easily the sharpest, followed by Melbourne (-5.6%) and Brisbane (-4.4%). This is to be expected, since Sydney’s house prices are the most expensive in the nation and it has the most indebted households. Therefore, Sydney is the most sensitive to interest rate rises.
How far Australia’s house price correction goes will ultimately depend on how far the Reserve Bank hikes rates. Regardless, the ‘record’ 10.7% decline in 5-city aggregate values recorded over 2017-19 looks set to be smashed.
