
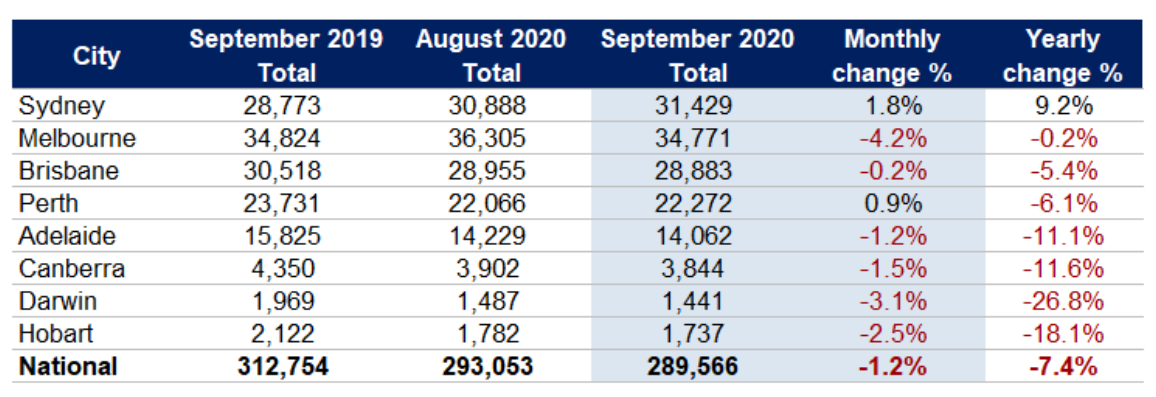
Earlier this month, SQM Research released its stock on market report for September, which revealed that for sale listings nationally declined by 1.2% over the month and by 7.4% year-on-year:
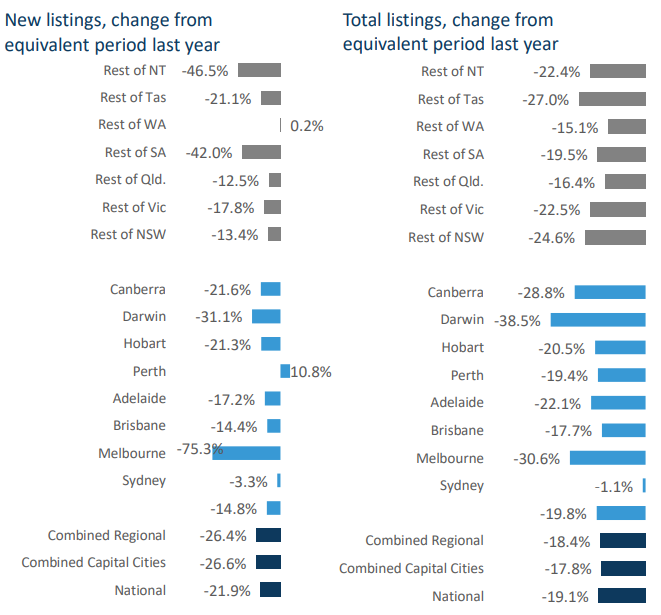
CoreLogic’s latest Housing Market Update supports SQM’s data, showing all regions except Perth recorded falling new and total listings in the year to September:
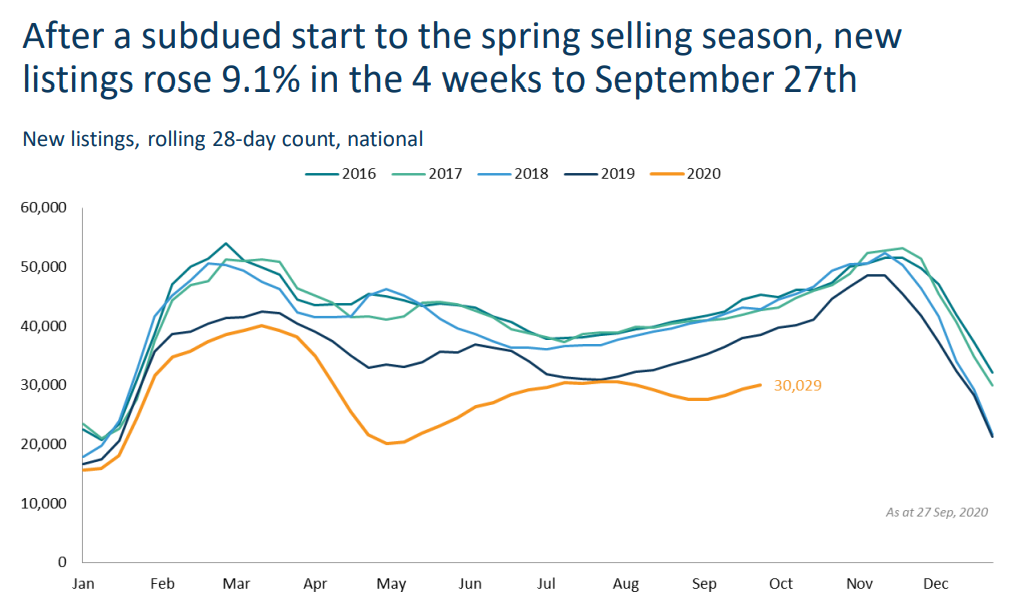
The next chart shows that new listings are tracking well below the equivalent periods in 2016, 2017, 2018 and 2019:
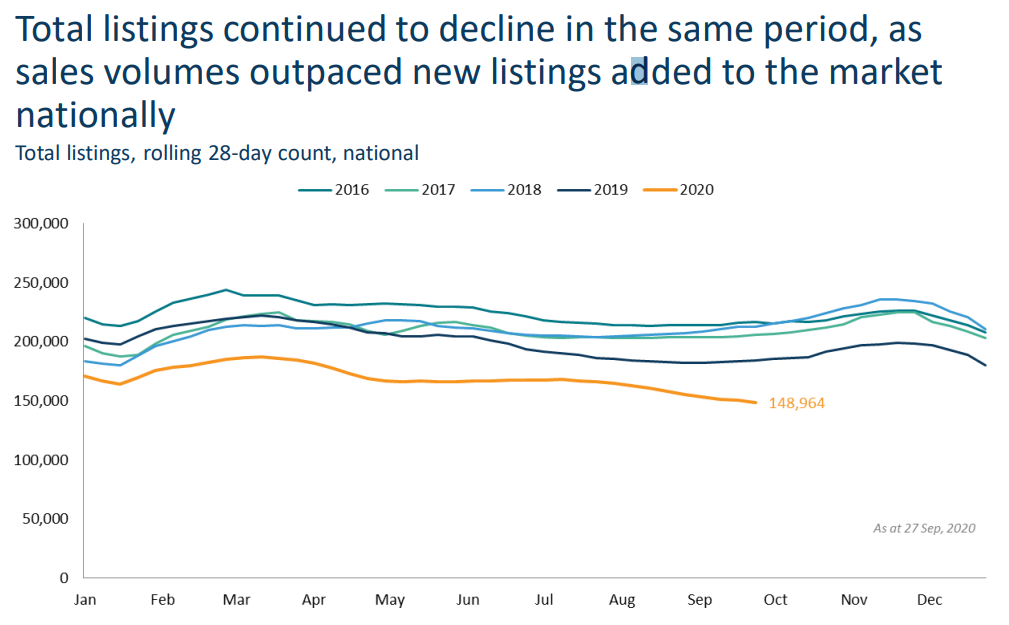
It’s the same story for total listings, which are also running way below 2016, 2017, 2018 and 2019:
While listings are depressed, actual sales volumes are estimated by CoreLogic to be running 2.8% higher than the same time last year:
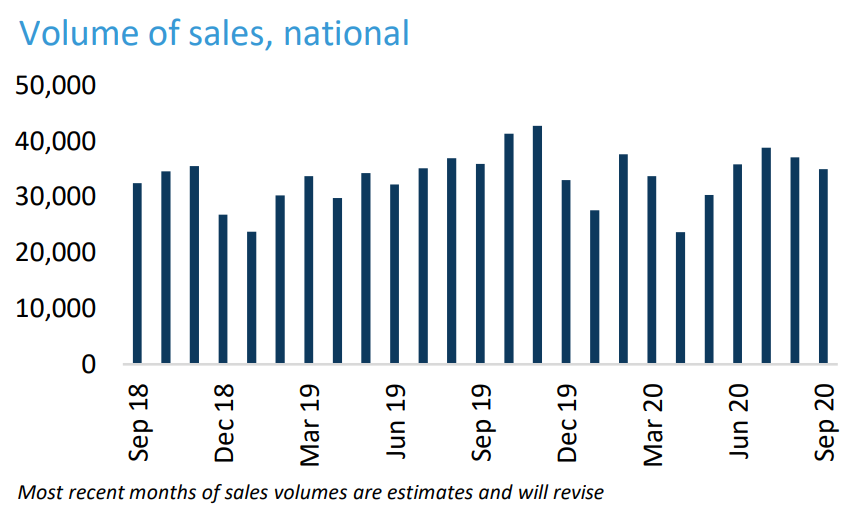
These dynamics help to explain why dwelling values have held up better than expected.
The key test will come should a tidal wave of distressed sales hit the market after emergency income support and mortgage repayment holidays are unwound.
