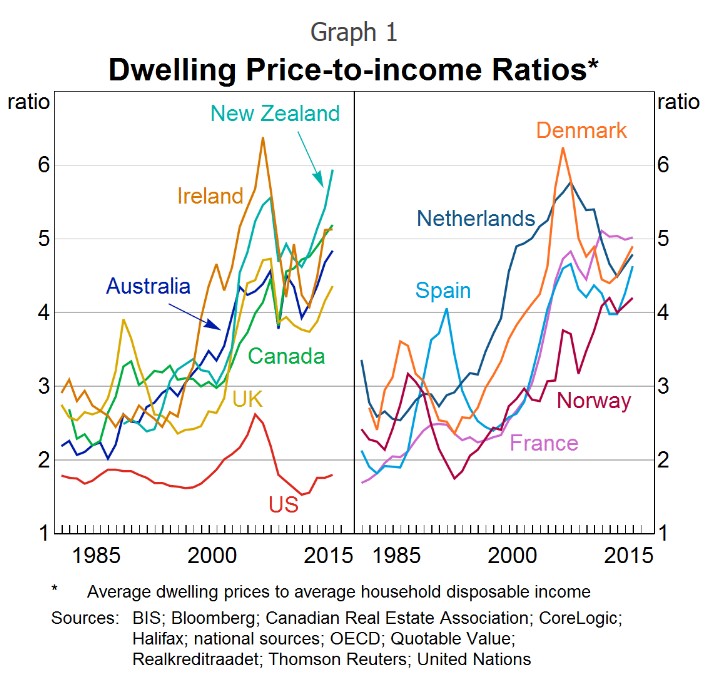
Let’s recall the chart and comments delivered by RBA Assistant Governor, Luci Ellis, in her speech on Thursday:
Australia is somewhere around the middle of the pack of mid-sized countries on this metric.
Similar comparisons of household debt-to-income ratios across countries also put Australia in the middle of the pack.
You will recall Friday’s post whereby I ridiculed Ellis’ calculation of Australia’s dwelling price-to-income ratio of 4.8, showing clearly that it was in fact more than 7-times at the capital city level and more than 6-times at the ‘rest-of-state’ level.
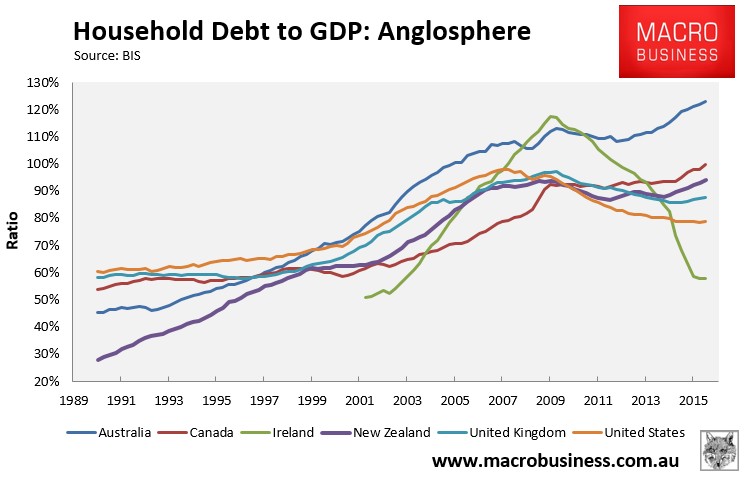
I also showed how Ellis’ claim that Australia’s household debt-to-income ratio was around “the middle of the pack” was patently false, given the Bank for International Settlements ranked Australia as having the third highest household debt-to-GDP ratio in the world, easily eclipsing other developed English-speaking nations:
Advertisement
I spent a large chunk of the weekend crunching data to assess whether Ellis’ claim that “Australia is somewhere around the middle of the pack of mid-sized countries” on the metric of dwelling prices-to-income.
Rather than attempt to work out what data the RBA has used, I have instead used national accounts data to assess:
Advertisement
Aggregate value of a nation’s dwelling stock (owned by households) against gross domestic product (GDP); and
Aggregate value of a nation’s dwelling stock (owned by households) against total employee compensation (income).
Due to time constraints, I have only examined data comparing Australia against other English-speaking nations (the ‘Anglosphere’).
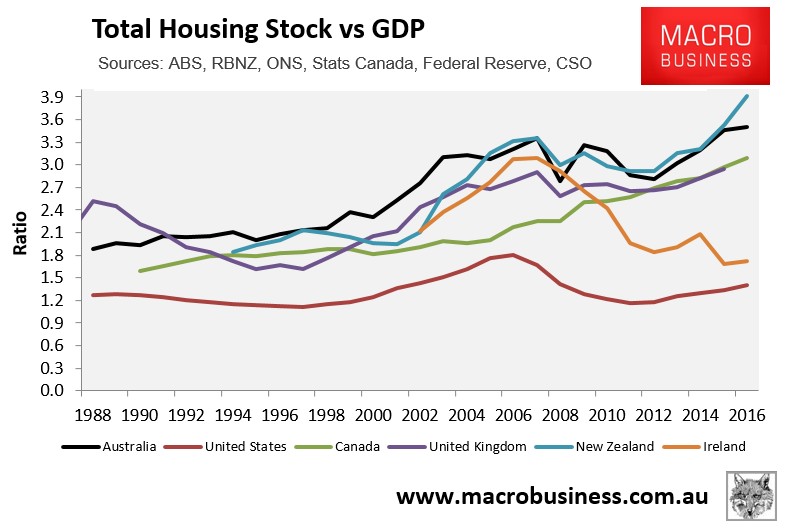
The first chart plots the value of the dwelling stock against GDP:
Advertisement
As you can see, Australia (3.5 times GDP) has the second most expensive housing market on this metric, behind New Zealand (3.9 times GDP), but well above Canada (3.1 times GDP), the United Kingdom (2.9 times GDP), Ireland (1.7 times GDP), and the United States (1.4 times GDP).
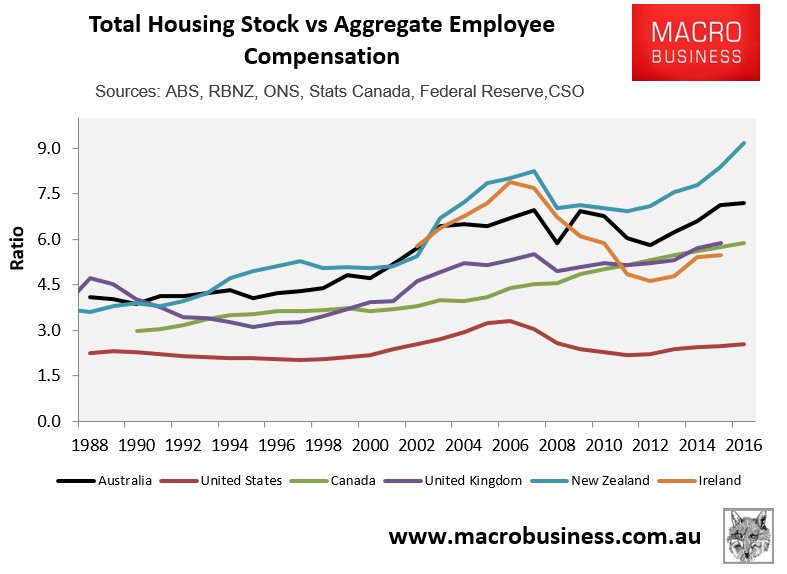
The next chart plots the value of the dwelling stock against total employee income:
Advertisement
Again, Australia (7.2 times incomes) has the second most expensive housing market on this metric, behind New Zealand (9.2 times income), but well above the United Kingdom (5.9 time income), Canada (5.9 times Income), Ireland (5.5 times income), and the United States (2.5 times GDP).
Clearly, the RBA’s claim that Australia’s housing is valued around “the middle of the pack” does not pass the sniff test. Australia’s housing is very expensive internationally, in addition to being fueled by the third largest household debt load in the world.
Leith van Onselen is Chief Economist at the MB Fund and MB Super. He is also a co-founder of MacroBusiness.
Leith has previously worked at the Australian Treasury, Victorian Treasury and Goldman Sachs.