Cross-posted from Gareth Aird, senior economist at the Commonwealth Bank.
Key Points
- Changes in productivity, the stock of debt, lending margins, fiscal policy and the exchange rate impact the neutral cash rate.
- We estimate the neutral policy cash rate has moved to a record low of just 3% (2½ – 3½% range) which is lower than our previous point estimate in 2014 of 3½%.
- A record low neutral rate means that very little tightening would be required to shift monetary policy from an expansionary setting to a neutral one.
Overview
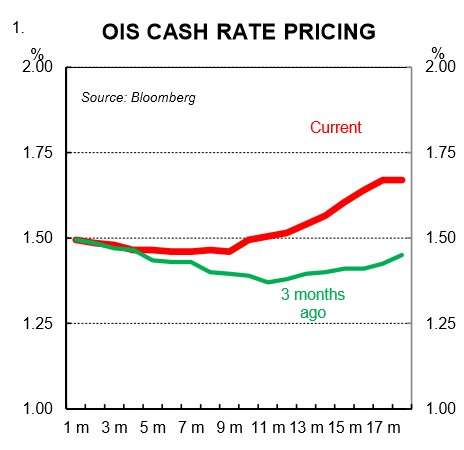
Over the past three months there has been a significant shift in market interest rates (chart 1). The yield curve has steepened and market pricing for another RBA rate cut has receded. Current market pricing indicates a small (15%) chance that policy is eased again. And it implies a 35% chance of a rate hike within the next 12 months.
CBA’s house view is that interest rates are on hold over 2017. And in our view, the risks over the year lie with a cut. But the steeping in the yield curve and shift in market expectations has led us to revisit our estimate of the neutral cash rate. The analysis confirms our earlier work that neutral it is much lower than in previous cycles which means that the cash rate would not need to rise by much for policy to no longer be having a stimulatory impact on the economy.
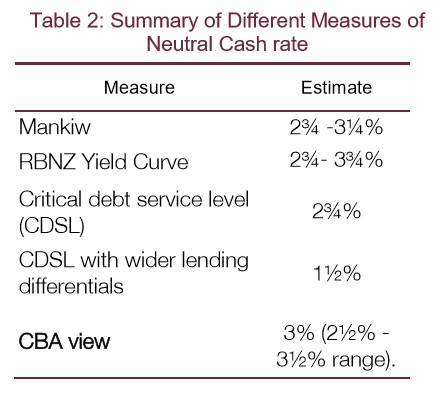
In this note we update our earlier qualitative and quantitative analysis to derive our estimate of neutral. We estimate it to be 3% (2½ – 3½% range) which means that the current cash rate is about 150bps in expansionary territory.
What is a neutral interest rate and why does it matter?
The level at which the RBA sets the cash rate can either have an expansionary, contractionary or neutral impact on economic activity. The neutral cash rate is the interest rate (or range of rates) consistent with full employment, trend growth and neither upward nor downward pressures applied on the price level through monetary policy. Or more generally, when the setting of interest rates is such as to exert neither contractionary nor expansionary forces on the economy, policy can be said to be ‘neutral’.
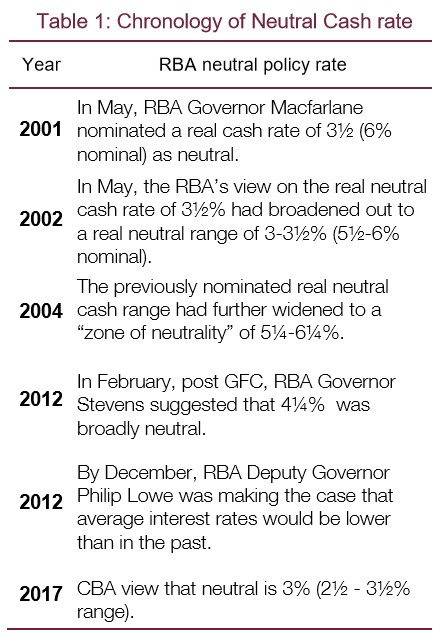
But the neutral rate it is not a constant rate. Rather it is influenced by changes in productivity, the stock of debt, lending margins, fiscal policy and the exchange rate. A chronology of neutral policy settings according to the RBA is shown in Table 1. These drivers have moved in a way over the recent past that indicates the current neutral cash rate is probably at a record low.
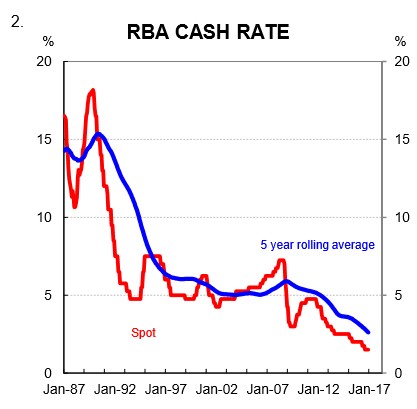
The neutral rate is an important benchmark rate for evaluating the stance of monetary policy. It allows us to determine how expansionary or contractionary a particular policy setting is at any point in time. One rule of thumb often used is comparing the level of the cash rate to a historic average cash rate to assess how accommodative or restrictive policy settings are. But that can be misleading because the neutral rate is fluid and varies over time. When we compare current policy setting to the neutral rate they do not look as expansionary as implied by comparing the current cash rate to the historic cash rate average.
A qualitative discussion:
Over the past thirty years the RBA’s policy rate has trended lower (chart 2). The neutral rate has also moved lower. In this section we present qualitative arguments as to why the neutral rate looks to have fallen to a record low. The five factors we cover here are (i) productivity growth, (ii) the debt to income ratio, (iii) lending spreads; (iv) fiscal policy; and (v) the exchange rate.
(i) Productivity growth is soft
During the 1990s, economic growth in Australia was powered by a significant lift in productivity. A number of key economic reforms undertaken in the late 1980s and 1990s enhanced the productive capacity of the economy and as a result, both growth and real incomes improved. The good times for Australian incomes continued after the turn of the century. But that was largely because of an income boost from a big lift in the terms of trade which concealed the fact that productivity growth had stepped down. Put another way, rising commodity prices masked the slowdown in productivity growth which kept interest rates higher than they would be otherwise.
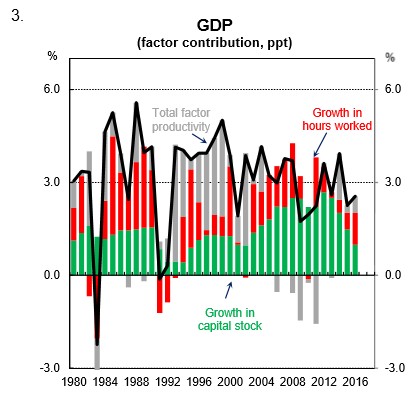
But since the terms of trade turned down in 2012 (notwithstanding the recent bounce), soft productivity growth has become illuminated because real per capita incomes have fallen. Multi-factor productivity, which is the broadest measure of productivity growth, has been soft over that period (chart 3). It has lifted a little recently, but that is largely because the mining boom has transitioned from the from the labour intensive investment phase to the production phase. Outside of the resources sector productivity growth is poor.
Weak productivity growth lowers potential growth in output per capita which ultimately lowers the neutral cash rate. A lower neutral cash rate results because a fall in productivity growth lowers the return on capital and labour, meaning that it is less desirable to invest and employ. And if the desire to invest is lowered while the desire to save is unchanged or higher then a lower interest rate is required to balance savings and investment plans.
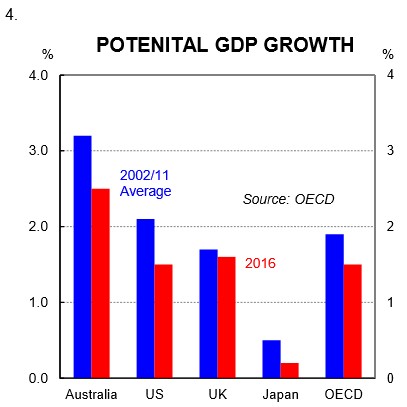
Here we note that Australia is not alone in having weak productivity growth. Most advanced economies around the world are also suffering from soft productivity growth and potential growth has fallen (chart 4). As a result, the neutral rate of most advanced economics is lower now than in previous decades.
(ii) Debt to income ratios at record highs.
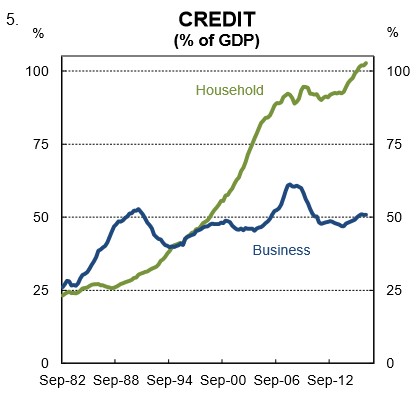
Australia’s stock of debt has been rising over the past year at a modest pace by historic standards (5.6% through the year to December 2016). But given weak income growth, the stock of debt has been growing faster than nominal GDP which means overall leverage in the economy has been rising (chart 5). The increase in leverage has been mainly driven by the household sector. And the debt has been going into bricks and mortar.
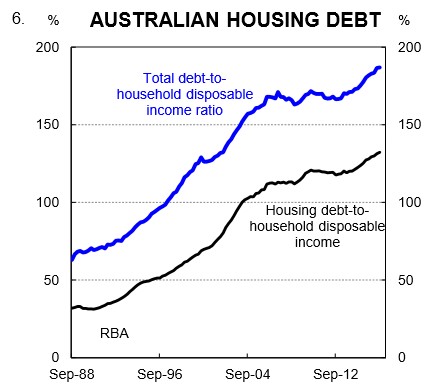
The increase in the stock of debt relative to income means that the household debt-to-income ratio is rising (chart 6). It is currently at a record high and puts Australia in the top tier of household indebtedness globally. As the RBA noted in its October Financial Stability Review, “household indebtedness continues to drift up and, with incomes growing more slowly than in the previous decade, households may not be able to rely on income growth to make their debt easier to service.”
The increase in the stock of debt relative to income means that debt burdens have risen. This puts downward pressure on the neutral interest rate. The policy rate required to keep interest payments constant as a share of income must fall if debt is growing faster than income. As a result, the neutral rate falls when debt is rising relative to income, all other things equal.
(iii) Lending spreads
Lending rates are interest rates that are faced by households and businesses. It is where “the rubber hits the road”. They are the rates that have the biggest influence on the economy and they are impacted by bank funding costs which are a function of both the RBA cash rate and conditions in financial markets. Prior to mid-2007, spreads between bank funding costs and the RBA cash rate were low and stable. With hindsight there was insufficient pricing of risk. As a result of the financial crisis and repricing of risk, spreads between bank funding costs and the RBA cash rate lifted which means that the spread between lending rates and the policy rate also rose.
After an initial levels adjustment higher as a result of the GFC, the spread between lending rates and the RBA policy rate has continued to inch a little higher (chart 7). This reflects changes in funding costs and the additional cost of capital banks are required to hold against home lending.
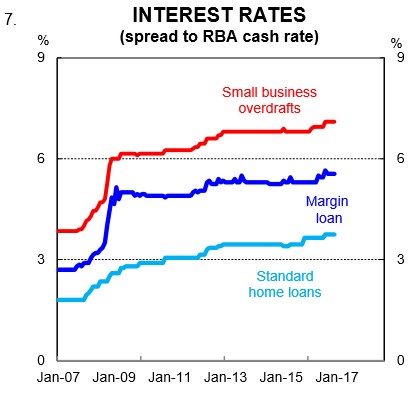
A higher spread between the cash rate and lending rates means that a lower cash rate is required to produce a given level of lending rates than in the past. The neutral cash rate is lower as a result.
(iv) Fiscal Policy
The stance of fiscal policy impacts on the economy. Expansionary fiscal policy acts like an accelerator on the economy and pushes up the rate of interest required to prevent the economy moving beyond full employment, other things being equal. Conversely, contractionary fiscal policy, or fiscal consolidation, acts as a brake on the economy. Under fiscal policy that is contractionary, the interest rate that is required to keep the economy growing at trend is lowered, other things equal.
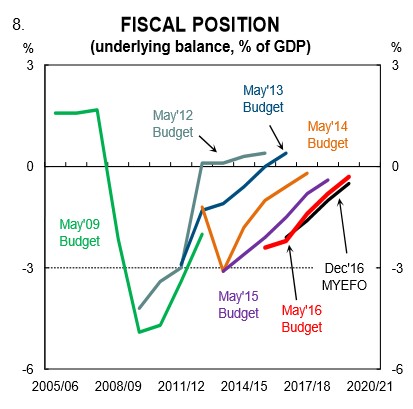
Fiscal slippage has been a persistent theme in recent years and progress in repairing the budget has been elongated. This has meant that fiscal policy has had a negligible impact on the neutral cash rate. But fiscal consolidation remains a priority of both major political parties (chart 8). The change in the budget balance is an approximate guide to the fiscal impact on the economy. And on that score, the 2016/17 Budget “takes out” 0.4%pa of GDP on average over the next four years. Fiscal consolidation will act as a headwind on the economy if these plans come to fruition and as a result it will put downward pressure on the neutral interest rate.
(v) Exchange rate
Financial conditions are also affected by the currency. Overall monetary conditions are determined by interest rates and the exchange rate. The higher the currency, the more restrictive monetary conditions are and vice versa. We have replicated the RBA’s fair value model whose inputs are based on the traditional drivers of the currency – interest rate differentials, export commodity prices and the current account (chart 9).
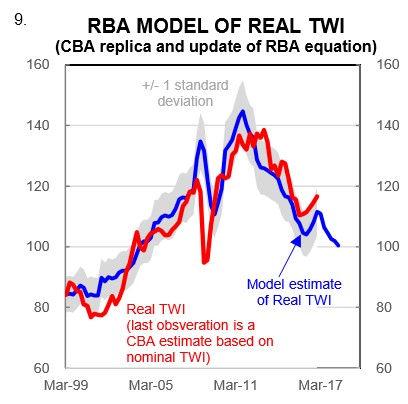
The model suggests that the AUD continues to trade a little above what looks like fair value, though the differential is not material. Notwithstanding, it does suggest that the level of the exchange rate is exerting some soft downward pressure on the neutral interest rate relative to where it would be if the AUD was trading at fair value.
A quantitative analysis
In this section we run three models to derive our estimate of the neutral interest rate: (i) Mankiw; (ii) RBNZ yield curve; and (iii) Critical debt service level (CDSL).
Mankiw Rule
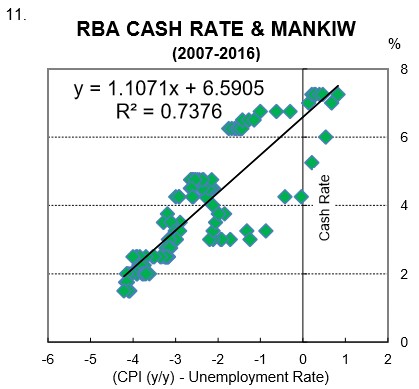
The Taylor Rule is the general term for a rule that sets a monetary policy rate (the RBA cash rate in this case) as a linear function of an inflation rate and a measure of economic slack. The Mankiw Rule is a variation of the Taylor Rule that uses the unemployment rate as a measure of economic slack. Using the CPI and the unemployment rate to model the RBA cash rate is logical because the RBA’s mandate is price stability and full employment.
Here we estimate a relationship between the RBA cash rate and the Mankiw Indicator (defined as the annual change in core CPI inflation minus the unemployment rate). It says that the cash rate is a linear function of CPI inflation minus the unemployment rate.
The red line in the chart opposite plots the derived Mankiw Rule cash rate against the RBA’s cash rate over the last ten years (the green line plots the derived Mankiw Rule cash rate over the last five years). The green line is below the red line meaning that neutral is now lower (chart 10).
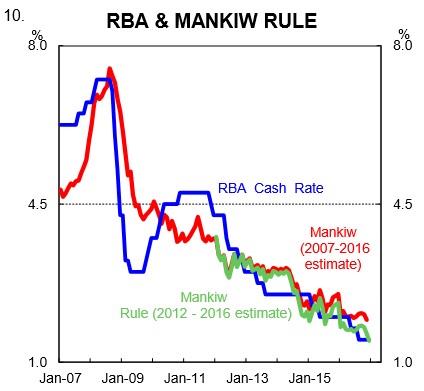
Based on the observed relationship between core inflation, the unemployment rate and the cash rate over the past five years we could expect to have an interest rate of around 2¾ – 3¼% if the economy was operating at full employment and inflation was within the RBA’s target band. The current cash rate of 1½% therefore implies that the RBA is pushing monetary policy some 150bps into expansionary territory from neutral on this measure.
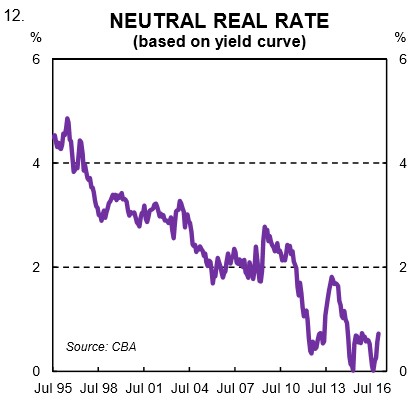
RBNZ yield curve model
The RBNZ developed a method of estimating neutral based on the slope of the yield curve. The idea is that over the business cycle monetary policy settings must be neutral if inflation is stable.
The divergence of the yield curve slope from “normal” is an indication of whether monetary policy is contractionary or not. In this approach “normal” is defined as the difference between the 90-day rate and the 10-year rate over a period. That difference is the term premium or average yield curve slope. The neutral rate can be calculated by subtracting the average yield curve slope over the period from the 10-year rate.
Taking this approach and applying it to the Australian yield curve indicates a neutral real rate of ¾%. Or 3¼% in nominal terms with a range of 2¾% to 3¾% (chart 12).
Critical debt service model
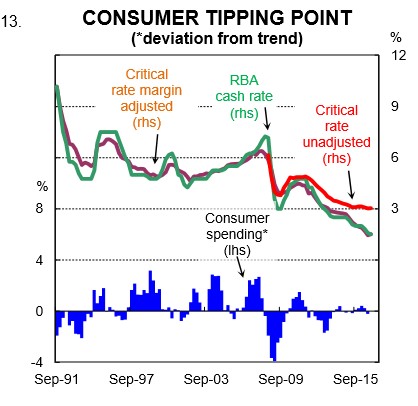
The imbalances associated with rapid growth in debt and asset prices are a recurring theme in the policy debate. Organisations such as the Bank for International Settlements have attempted to develop indicators of financial stress. The same approach can be used with debt servicing.
The idea is that there is a certain critical debt service level over and above normal where the resultant “stress” has a significant impact on consumer spending. That critical level can be determined by benchmarking deviations in debt servicing against deviations in consumer spending growth.
The approach is quite neat because once the critical debt service ratio is known, it is possible to work out what cash rate you need to get there. One description of neutral is the rate at which interest rates are neither stimulating nor weighing on economic activity. So the implied cash rate in these calculations should be an approximation for neutral.
The model suggests that the current critical level would be breached with an RBA cash rate of around 2¾% (chart 13). Adjusting for the change in lending spreads means the critical rate would be breached at a cash rate of 1½%. In other words, any tightening from here would have a significant negative impact on consumer spending. The rate is at a record low because the stock of household debt is at a record high relative to income. Policy easing over recent years has not resulted in the stock of debt falling as a share of income even though rate cuts make debt repayment easier. Instead, rate cuts have contributed to a lift in borrowing because debt looks cheaper. Dwelling prices have risen as a result.
Summary and policy implications
A range of estimates and theoretical arguments suggest that the neutral cash rate has moved to a record low. Our qualitative and quantitative analysis points to a neutral range of 2½%-3½% meaning a point estimate of 3%. The analysis suggests that the RBA is faced with a relatively easy task if it needs to put the brakes on the economy at some point further down the road. It wouldn’t take a lot of tightening in policy to restore monetary policy to a neutral setting. The flip side is that it becomes harder for the RBA to stimulate the economy as the neutral rate falls and we approach the lower bound. The limitations of monetary policy to stimulate growth become more apparent when the neutral rate falls towards the lower bound. The need for meaningful fiscal policy reform grows as a result. We don’t see the RBA tightening over 2017. And in our view the risks like with further easing. Calls for fiscal policy reform in addition to higher levels of public investment will continue.