
The Reserve Bank of Australia (RBA) yesterday released real household disposable income (HDI) data, derived from the September quarter national accounts (released Wednesday), which revealed that real per capita HDI fell by 0.1% over the quarter but were up by 0.4% over the past year.
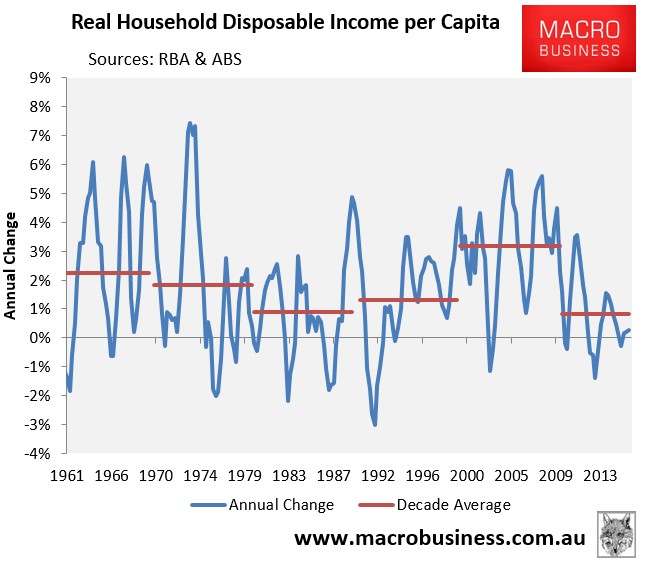
The below chart tracks real per capita HDI on a 4QMA basis:
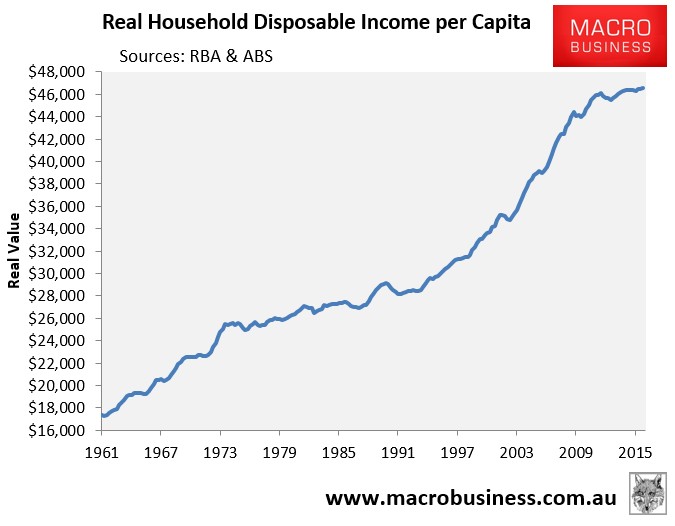
As shown above, Australian households are experiencing the biggest income shock since the early-1990s recession, with per capita real HDI registering almost zero growth (+0.9%) since June 2012.
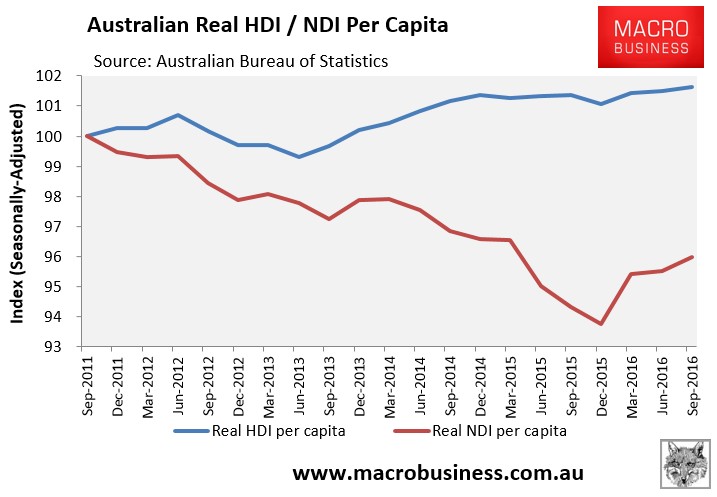
Still, real per capita HDI has held-up much better than national disposable income (NDI), which has has falling 4.0% since September 2011 in seasonally adjusted real per capita terms (see next chart).
The resilience of HDI may be explained by household consumption’s increased share of output, as shown in the next chart:
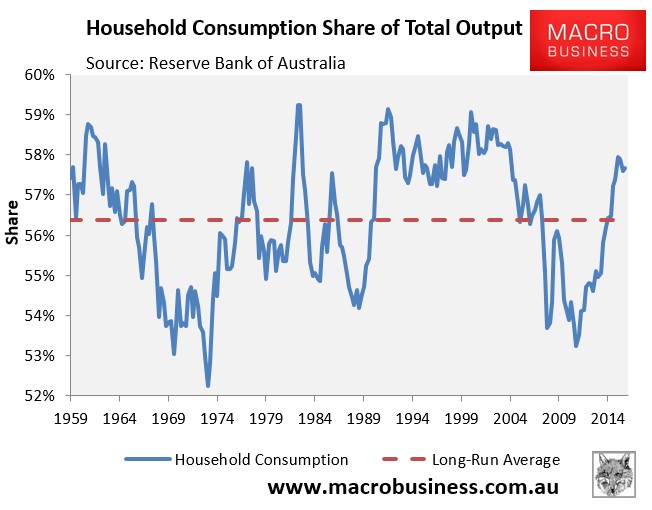
In September 2011, household consumption comprised 53.2% of output, whereas at September 2016 it comprised 57.7% of output – well above the long-term average of 56.4%.
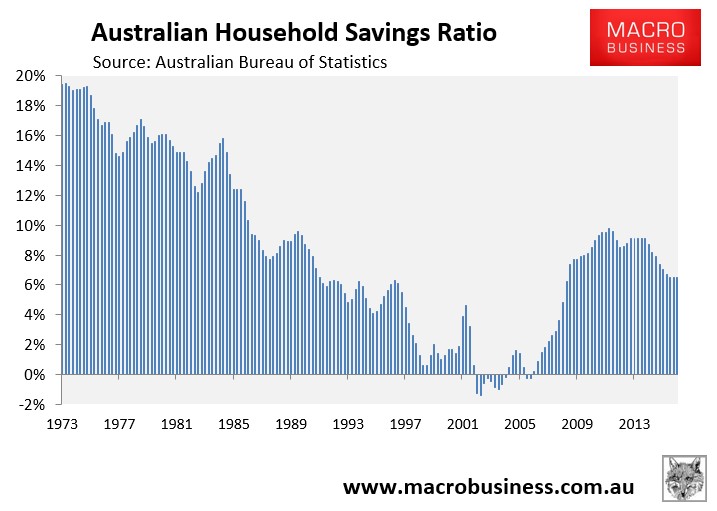
The rising share of household consumption is explained, in part, by the reduction in the household savings rate over the past five years:
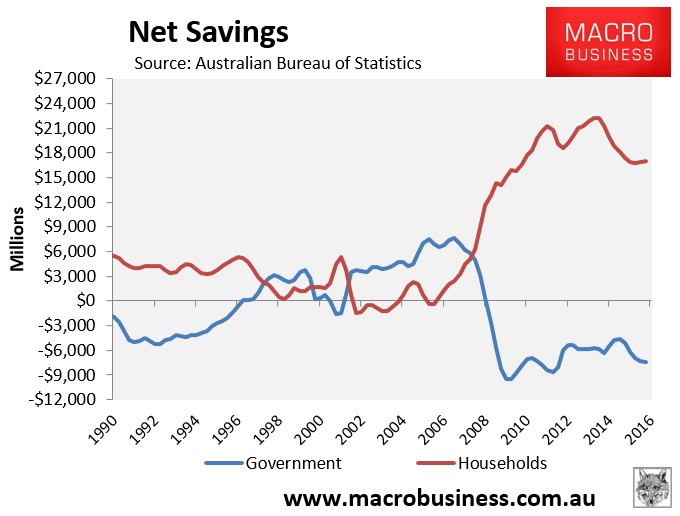
Another factor cushioning household’s is public borrowing’s (the Budget deficit):
Nevertheless, the growth in real per capita HDI so far this decade remains anaemic at just 0.8% per annum, which is lower than the 1960s (2.3%), 1970s (1.8%), 1980s (0.9%), 1990s (1.3%), and 2000s (3.2%):
Just another sign of Australia’s ‘lost decade’ in the making.
