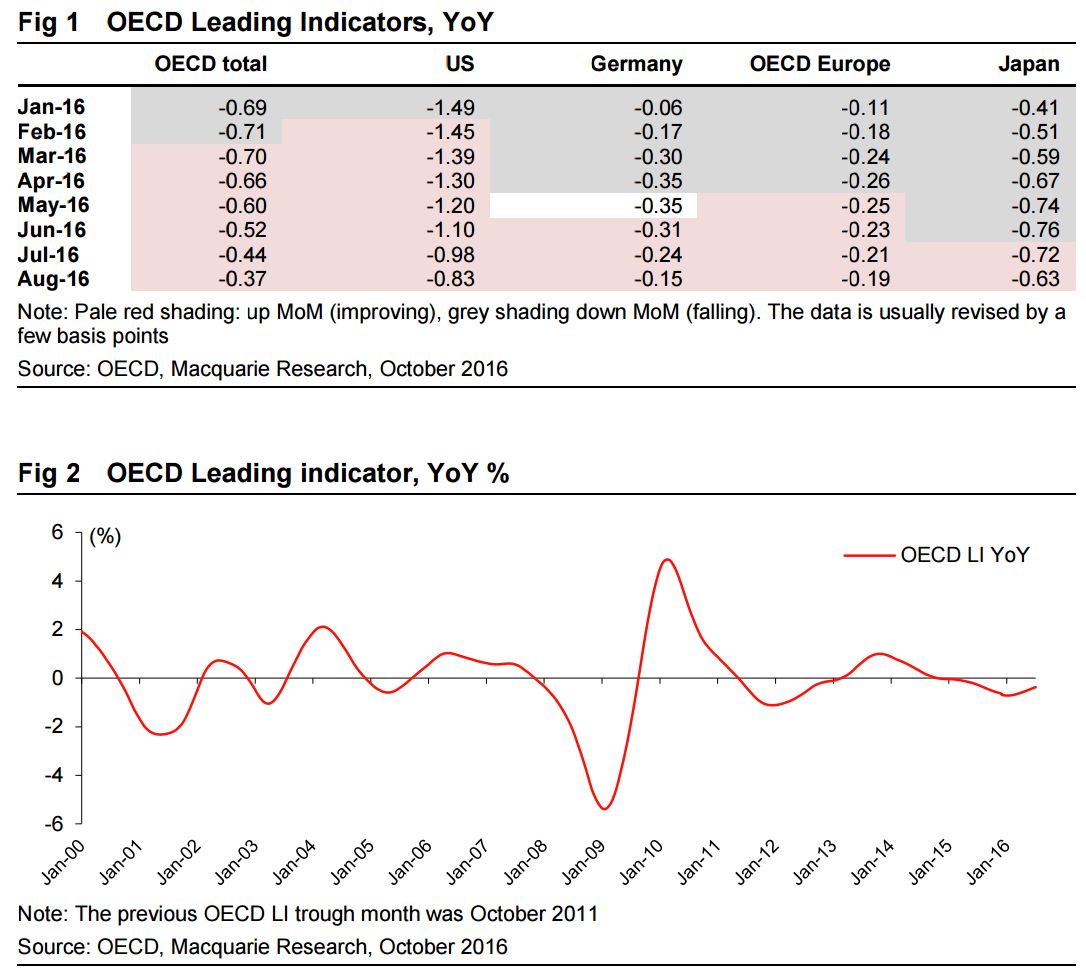
The global IP recovery is continuing post its December 2015 nadir of +0.4% YoY, with the latest reading being +2.0% YoY in August 2016. Please see the 12 October 2016 Commodities Comment. Our 2017 forecast is +2.4%. This drives a mild acceleration in global real GDP growth through 2017. This broadening of growth is supported by the OECD LI, below, which focuses on GDP and inflected in March 2016. The eurozone is now following the US into an employment-led recovery, from page 3. The US is expected to continue its long grinding cycle recovery, from page 5. China’s real GDP growth rate is forecast to fade gently (2016 6.7%, 2017 6.4%, 2018 6.0%), from page 7, whilst EM economies in general continue to grow at recent moderated rates. The global real interest rate is expected to rise with the cycle, from page 9.
If the first leg of the recovery in commodity prices this year was sentiment-driven, being a realisation that China was not going to collapse and the Fed was not going to tighten aggressively, the second has been based more on the fundamentals. For some, especially the industrial-focused commodities, stronger demand growth has driven the delta. In others, supply cuts have been overdone. The end result is similar. Prices across a broad range of commodities have had to rise to invoke a positive supply reaction, the polar opposite of end- 2015.
These are topics we explore further in our recent Commodities Compendium. We are comfortable that, after a year-end dip, the first half of 2017 will see a continuation of the factors that have assisted commodity markets in recent times, with manufacturing and Chinese construction outperforming. Our confidence that January 2016 marked the nadir continues to grow.
But to be clear, fundamentals do not point to any sustained inflationary bottlenecks ex raw material constraints. The long-term challenges of overcapacity and lower industrial demand growth than recent norms are still very much in place, while the semi-permanent state of low interest rates means the ‘reset button’ of producer failures has essentially been removed, particularly as governments become more and more involved.
Thus, if 2016 was the year of relief for commodity producers, then 2017 provides a window of opportunity for sustainable strategy to be formed, as the long-term prognosis of weaker economic growth has not changed. Commodity price inflation over 2016 has eased the pressure on producer balance sheets, but growth options remain limited in the main. In both metals and energy, we expect 2017 to mark a pick-up in industry capex and also a return to cost inflation.
In oil, the agreement among OPEC members to cut production to a range between 32.5 and 33.0 MM BPD certainly stunned the market. The agreement, even if it is ratified at the November 30th OPEC meeting and tightly executed, only changes our rebalancing base marginally. It does however cut off the upwardly biased production skews that could have stretched the rebalancing period out as far as one year beyond our mid-2017 base case. In our assessment, the 33.0 MM BPD target is achievable and may turn out to be a smart move. In a recent note we analysed scenarios below which allow the agreement to work. The deal will have to (1) allow members which have ongoing supply disruptions to grow, (2) allow weaker members to stay flat, (3) have buy-in from rich members for material production cuts, and (4) have Russia participate. The risk to OPEC is that the desired price response may be a needle threading exercise – not enough price action results in a market share giveaway and too much price action accelerate shale growth, i.e. market share giveaway.
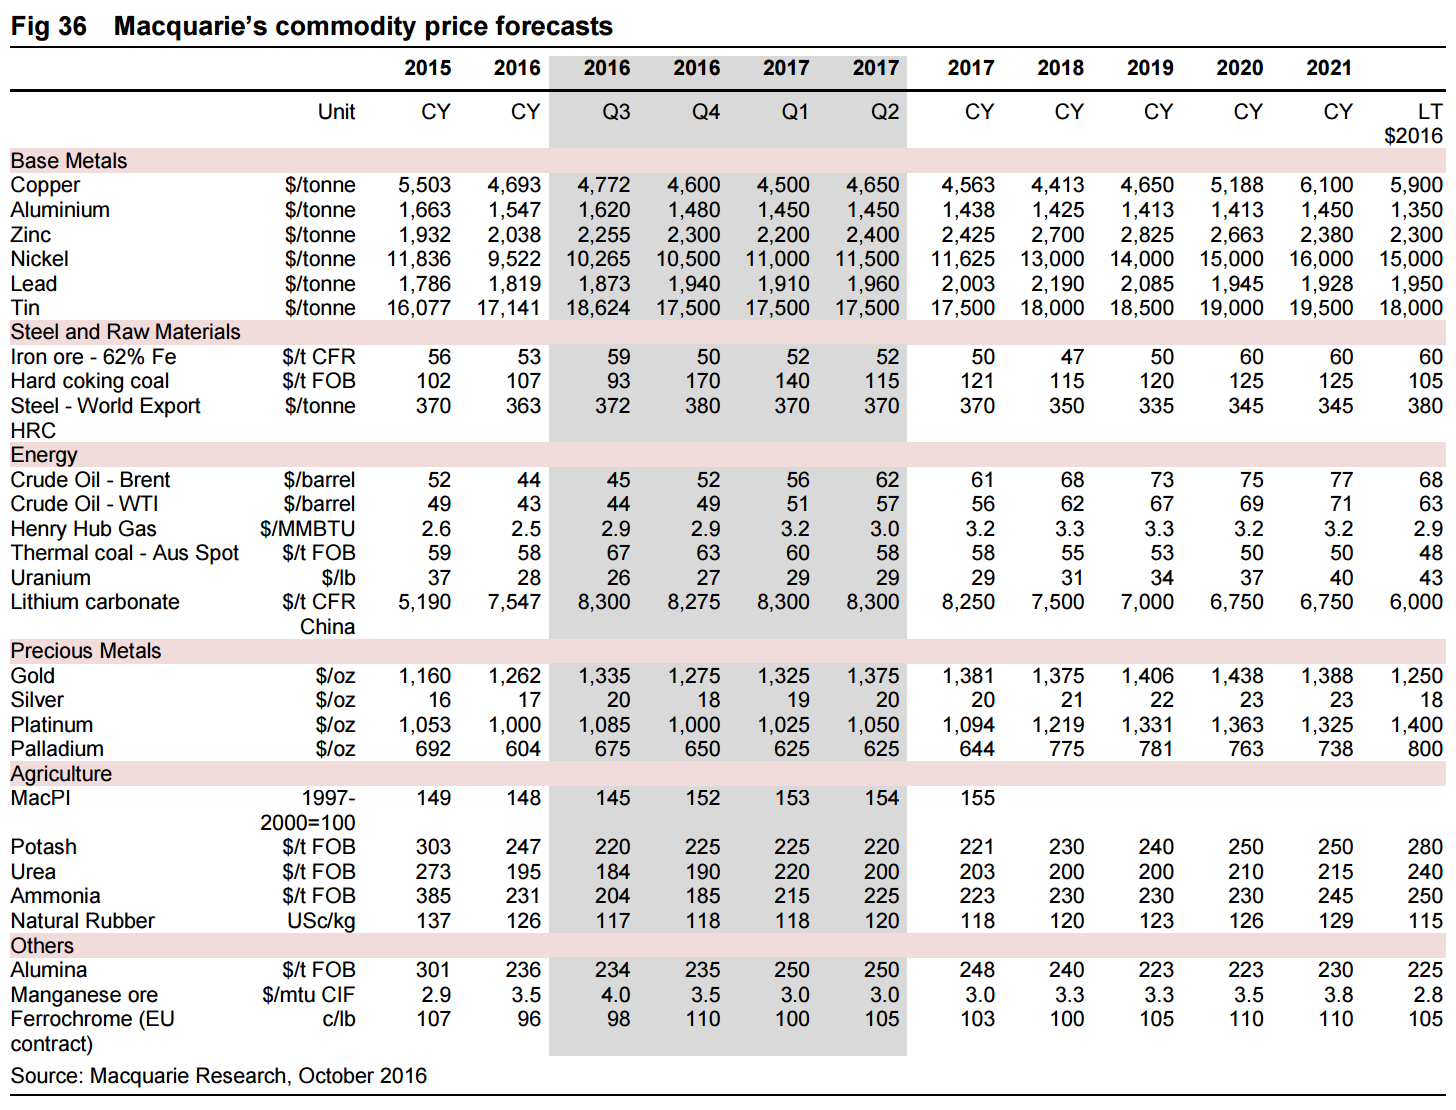
The coal markets remain a key area of focus. Notably, 4Q hard coking coal has settled at $200/t FOB Australia – up over 100% QoQ. This level, while still slightly below current spot, comes in above most expectations (our forecast was for $170/t) and marks the highest USD settlement since 3Q12 and the highest in AUD since 2011.
The catalyst for tightness in the coal market has been the Chinese supply restrictions seen this year. However, with prices now accelerating higher, these restrictions are being eased. Prior to the October Golden Week holiday, the NDRC issued a notice that 791 coal mines that met the “Level 1 safety standard” in 2015 would be allowed to lift their operating rate to their previous 330-day registered capacity level rather than operate at the restricted 276-day output level for the remainder of the year. In all, our industry contacts expect up to 900 mines could lift output in 4Q16. The impact of these coal mines lifting output back to the full 330-day output rate should be around 60–80mt of additional coal supply in 4Q alone, but this supply is likely to be biased more to thermal coal than met. Nonetheless, we expect this supply increment to result in lower coal prices for both thermal and met in the months ahead.
Agricultural commodity markets have underperformed other commodities since the start of the year, dragged down by continued weakness in grains. Indeed, Macquarie’s proprietary MacPI agricultural commodity index ended August at 143.1, just below end-December levels, but with the staple grains component down 13.5% over the same period. While weather risks may have been building into mid-year, they have since dissipated. As a result, we have now seen four seasons in a row with close on perfect production, and with crops all but realised, US ending stocks are set to be once again higher. With this, the pressures on agricultural supply are increasing. Even in a low-interest-rate environment, farmers are struggling. The potential for more widespread farmer bankruptcies in the US is rising, and while this will not cause permanent supply reduction it may lead to a loss of planted area in 2017.
For the remainder of 2016, a combination of a likely Federal Reserve rate hike and the standard 4Q Northern Hemisphere industrial slowdown does not bode well for commodity prices. Already in October bullion prices have tumbled as a hike comes into view, while the noticeable increase in long-term bond yields could mark the start of a structural shift which may have large repercussions, something we considered here.
While improved Chinese confidence means the 2015 whiplash event and subsequent demand vacuum is highly unlikely to be repeated, we expect steel and bulk commodities to come under some pressure, while precious metals will also underperform. In contrast, we believe US natural gas, nickel, alumina and nitrogen will outperform. Met coal is very much a special situation, with acute supply constraint likely to be transient.
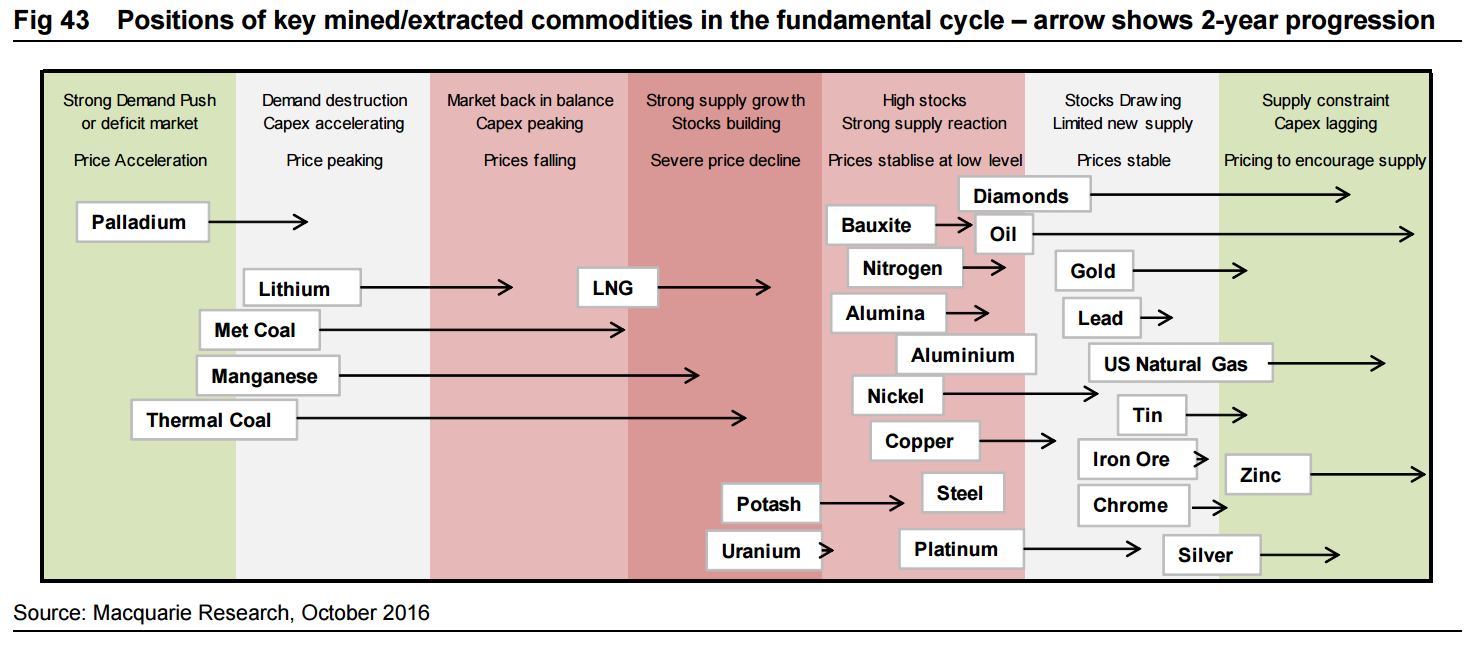
In the medium to longer term, supply remains a differentiating factor across commodity markets. Exposure to those commodities for which demand growth will need to reincentivise latent supply through price inflation is preferable, while exposure to those with true raw material constraints is a must. On an 18-month view we are bullish on US natural gas, crude oil, nickel, zinc, gold, silver and chrome from today’s levels.
We are concerned that the longer-term challenges of persistent overcapacity are underappreciated for potash, alumina, aluminium and steel.
In the bearish corner, we have Goldman Sachs:
After a year in which Chinese restocking and supply-side reform have had a significant impact on bulk commodity prices, many investors are asking whether the green shoots of western world demand pick-up, coupled with the potential for fiscal stimulus (rather than monetary easing) will drive the next leg of the metal cycles. The potential for a traditional industrial cycle-led demand recovery was highlighted in a report by our Australia and New Zealand economist team ‘Morphing from a debt deflation cycle to a traditional industrial cycle’, September 1, 2016. A recovery driven by non-China industrial sectors would be likely to focus on demand for the traditionally ‘later cycle’ commodities — aluminium, copper, nickel and zinc. So, after the strong bulks rally but overall inertia in base metal prices in 2016, focus is on whether Western World fiscal stimulus will drive a rally in base metal prices.
We think a rally in base metal prices is unlikely given:
Non-China demand for base metals has fallen sharply in the past decade.
Base metals are well supplied with inventory levels high across the board.
Any slowing in Chinese demand would likely offset any Western World pick up.
Metals (and energy) have much deeper and more mature financial markets and thus are less prone to speculation led rallies, which we believe are partly responsible for the increase in the prices for bulks, along with supply-side drivers such as regulation. Therefore, we believe the recovery in economic growth in the Western World will not have enough potential to drive metal prices higher. Based on our Commodity team’s forecasts, there is less downside to base metals and gold at current levels and consequently some global base metal equities — such as S32, Aurubis and Cameco — will likely outperform their more bulk exposed peers.
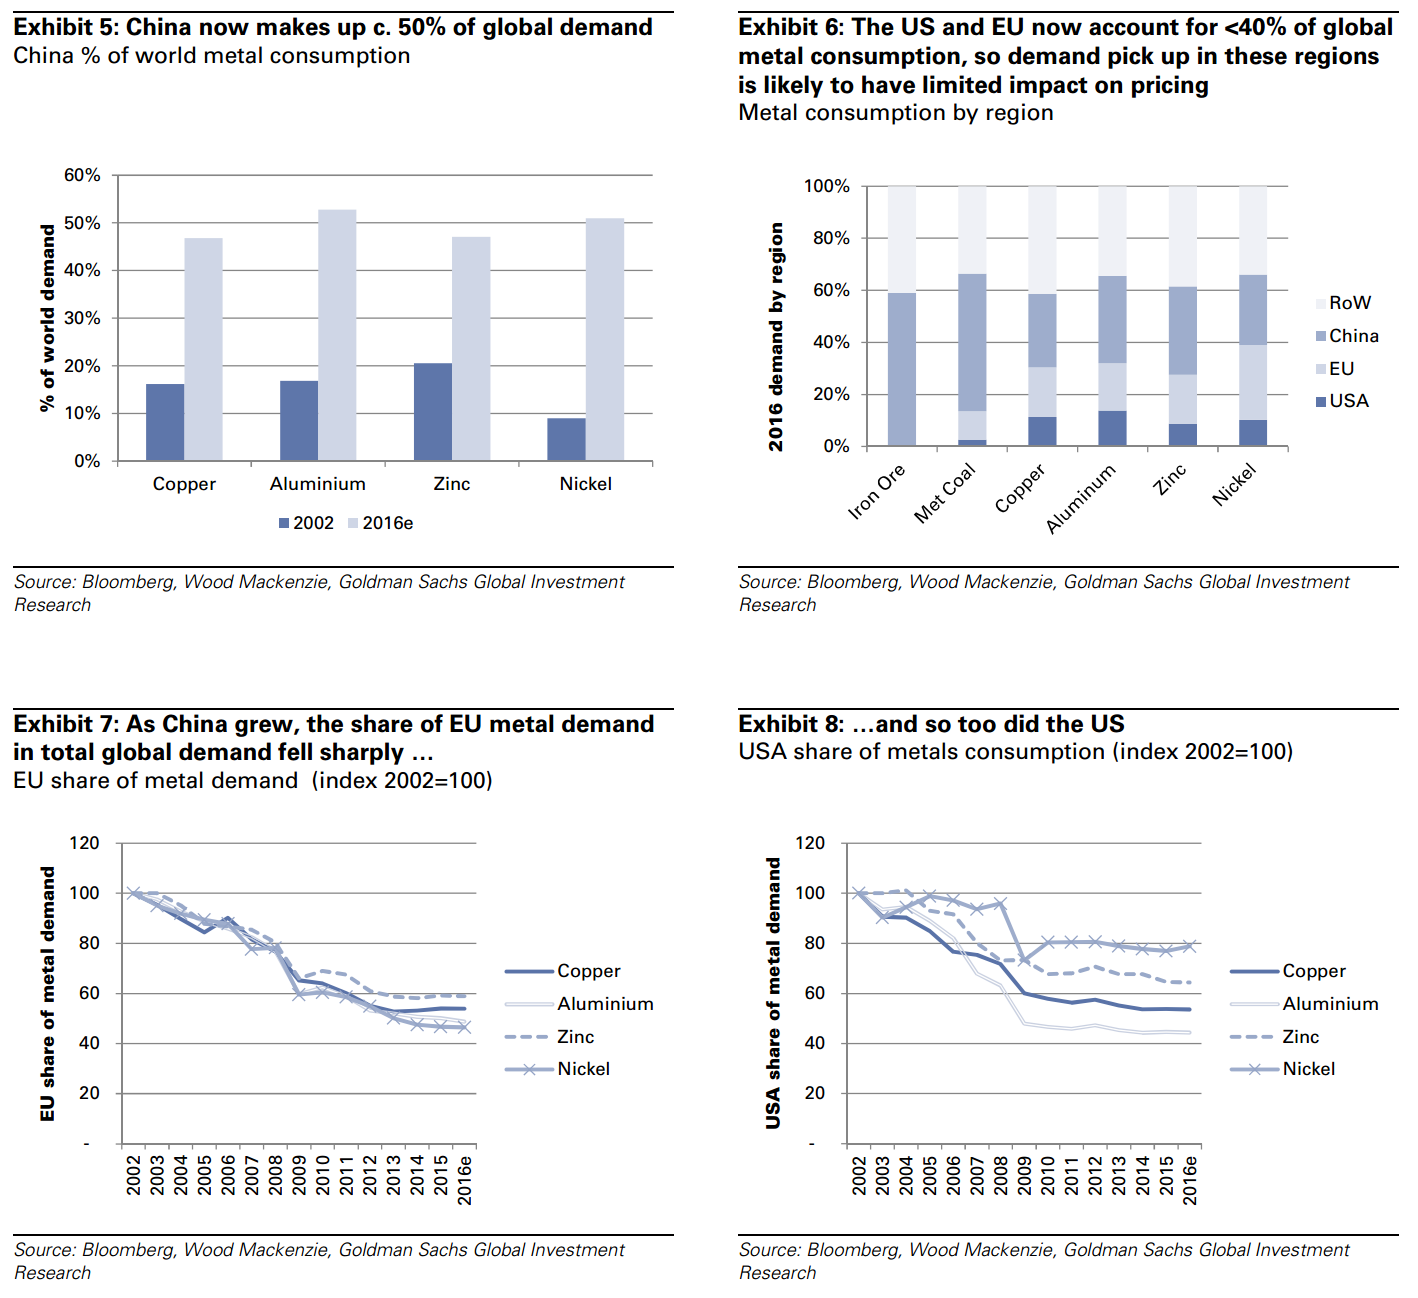
The decline in relevance for non-China metal consumption
China has accounted for over 100% of demand growth for most metals since 2002 and is now the major consumer of metals. Even when combined, the EU and US consume less metal than China. Consequently, although developed market growth is undoubtedly a positive for metals prices, its effect on physical demand is limited.
The emergence of China has significantly reduced the importance and impact of US & EU (or more broadly OECD) metal demand. Therefore, we think the impact of any demand recovery in these regions will have a more muted impact on metal prices than in previous similar cycles. Western world demand indicators Before the emergence of China as the main driver of metal demand (ie, before 2002), US housing starts, Lead Economic Indicators and M2 were the key macro indicators used to assess the directional movement in base metal prices such as copper and aluminium.
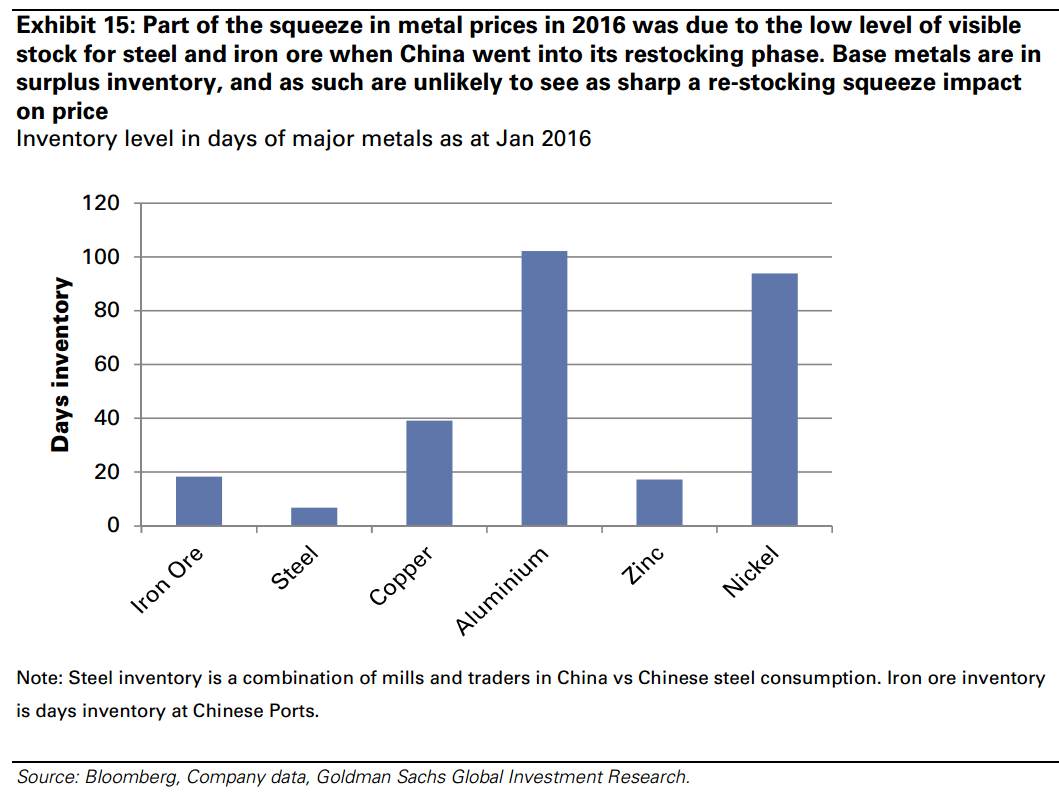
Inventory levels remain high
We believe the significant uplift in bulk metal prices in 2016 was supported by low levels of inventory, especially steel and coal, in China. Essentially, we attribute price moves to aggressive re-stocking in 2H15 and 1H16. Inventory levels of steel were at ex-GFC lows in 2H15 — and thus a rise in steel prices forced a significant re-stocking of both steel and iron ore, having an impact on price.
Whilst steel and iron ore inventory levels were low at the start of this year, the same can not be said for the base metals – with the possible exception of zinc. We would contend that the adequate level of stock (coupled with deeper futures and financial markets for the base metals) would preclude any significant upward pressure on prices stimulated by a moderate rise in Western World demand.
Could a pickup in demand shift metals from surplus to deficit?
Since 2002, non-China metals demand growth has effectively been zero. The year of maximum demand for base metals was 10% in the year coming out of the GFC (i.e. 2010). Given the 10% was off a recessionary environment we wouldn’t expect that type of growth YoY in 2017, even if fixed asset investment in both the EU and the US were ramped-up. Even a 5% elevation would represent a strong pick-up, in our view, and would be significantly above our forecasts of a c.1% uplift.
If there were a 5% uplift in US & EU, we calculate demand it would drive incremental demand as follows;
Copper – 245kt
Aluminium – 645kt
Zinc – 307kt
Nickel – 49kt
However, given current inventory levels, both copper and aluminium would remain in surplus for 2017. We already expect Zinc and nickel to be in deficit so any incremental demand would compound this.
The charts below look at what demand levels for metals would be needed to balance the markets in 2017.
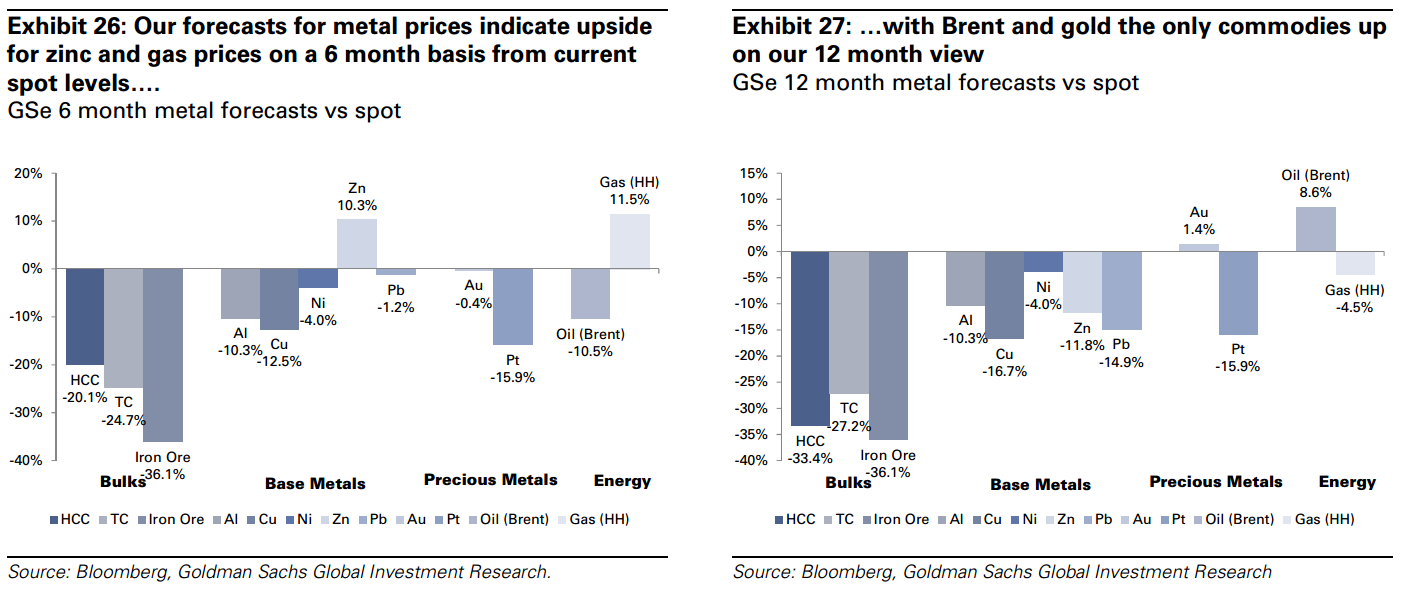
Commodity forecasts – We prefer zinc and nickel Given the deficit we expect in both nickel and zinc markets, relative to the surplus we see in aluminium and copper, we prefer the former base metals from a price perspective into 2017. The charts below look at the forecast move from spot to meet our price forecasts over 6 and 12 month timeframes.
So, for the Macquarie bulls it’s more of the same recovery for 2017. For the Goldman bears it is a big flame out with the bulk surge falling back to under-performing base metals. Both are modestly bullish oil.
For what it is worth, Goldman was much better at forecasting than Macquarie during the commodity bear market. But this year Macquarie has been well ahead of Goldman.
Advertisement
My own view is that China is going to come off and I don’t see enough offset anywhere else for metals. Plus, supply is still abundant, certainly more so than Macquarie’s commodity cycle chart suggests.
Thus MB sides with Goldman for the full duration of 2017 though the short term is in the lap of the Gods.
David Llewellyn-Smith is Chief Strategist at the MB Fund and MB Super. David is the founding publisher and editor of MacroBusiness and was the founding publisher and global economy editor of The Diplomat, the Asia Pacific’s leading geo-politics and economics portal.
He is also a former gold trader and economic commentator at The Sydney Morning Herald, The Age, the ABC and Business Spectator. He is the co-author of The Great Crash of 2008 with Ross Garnaut and was the editor of the second Garnaut Climate Change Review.