
In recent weeks I have presented data showing that the historical relationship between dwelling prices and the value of housing finance commitments (excluding refinancings) has broken down somewhat over the latest housing cycle:
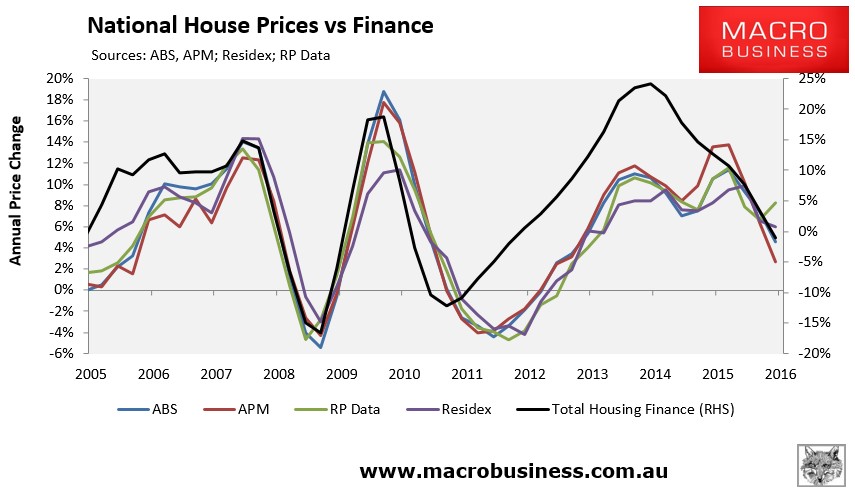
I also teased two potential explanations for this breakdown:
- falling transaction volumes, whereby falling finance commitments are chasing even fewer homes, thus resulting in still-rising prices; and
- the potential for cash buyers, such as buyers from overseas, whom are not captured in the housing finance statistics.
Today, I want to focus on the first explanation: falling transaction volumes, which are illustrated below using ABS data.
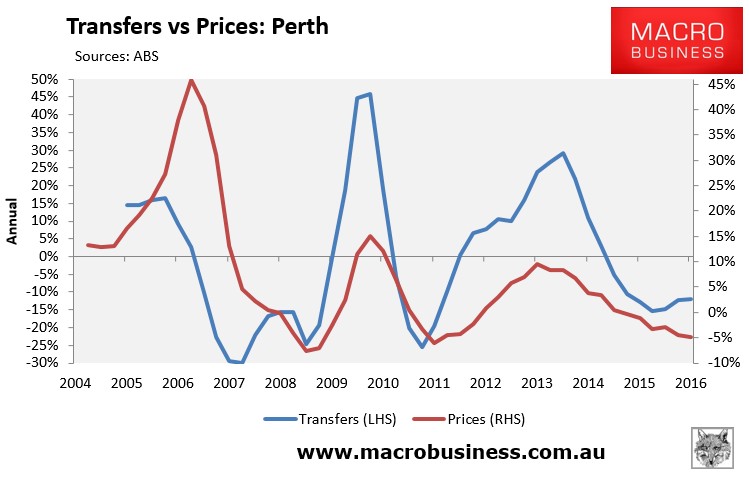
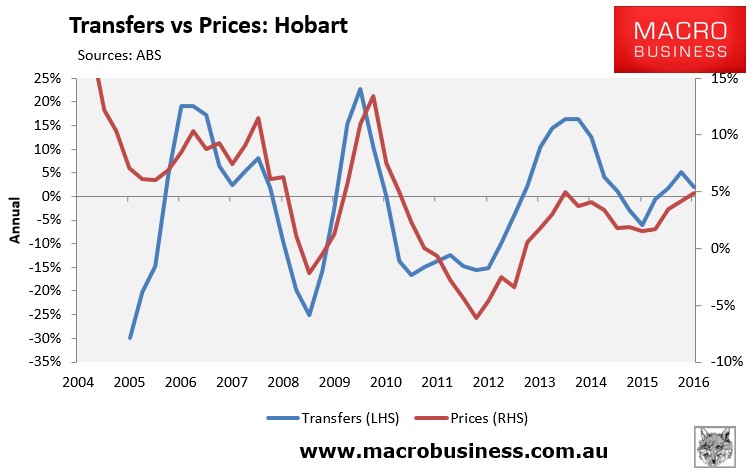
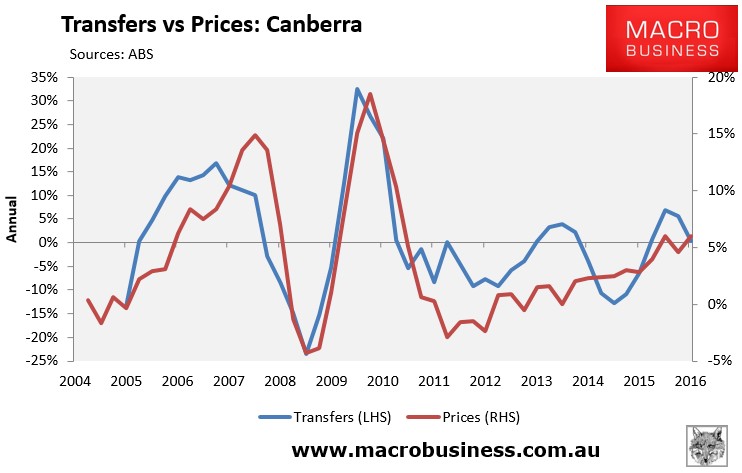
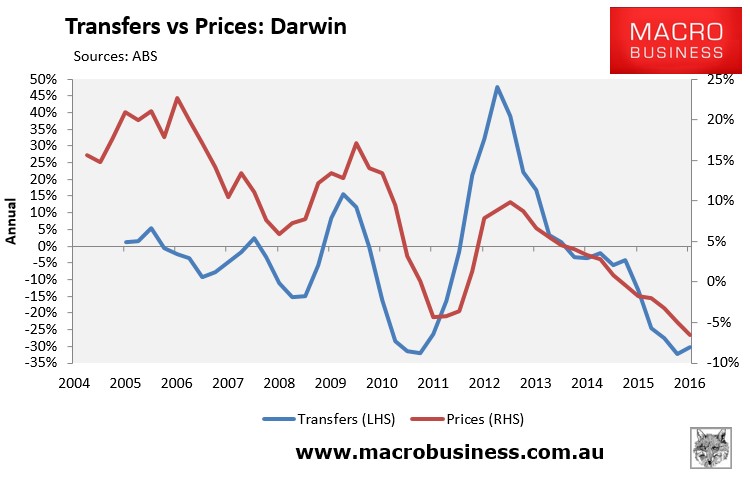
First, the below charts show the quarterly number of dwelling transfers at the national capital city level, as well as at the individual capital city level:
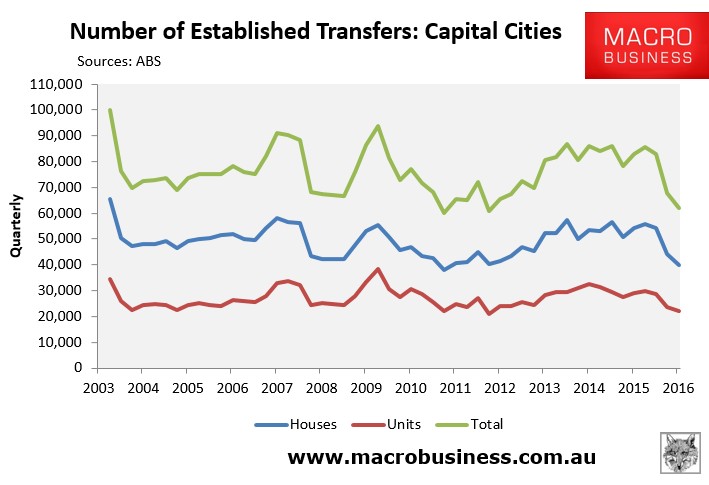
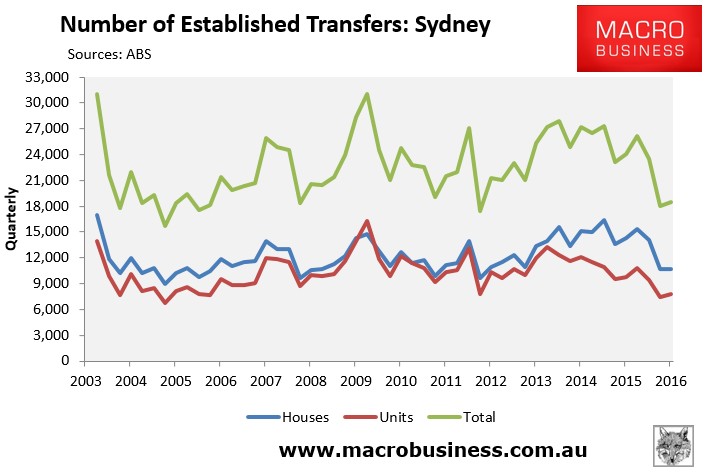
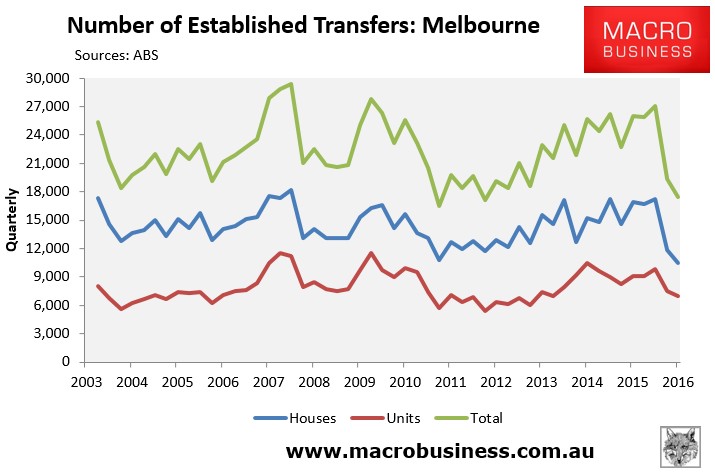
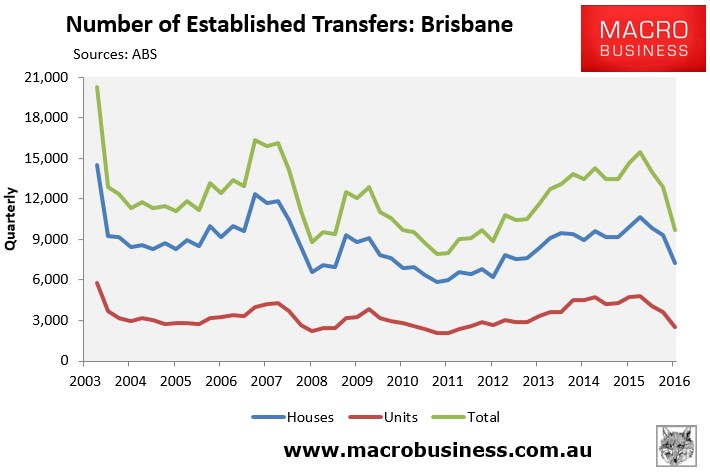
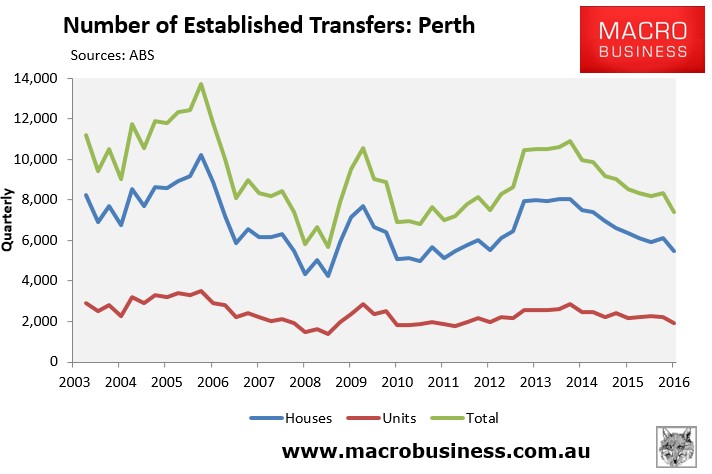
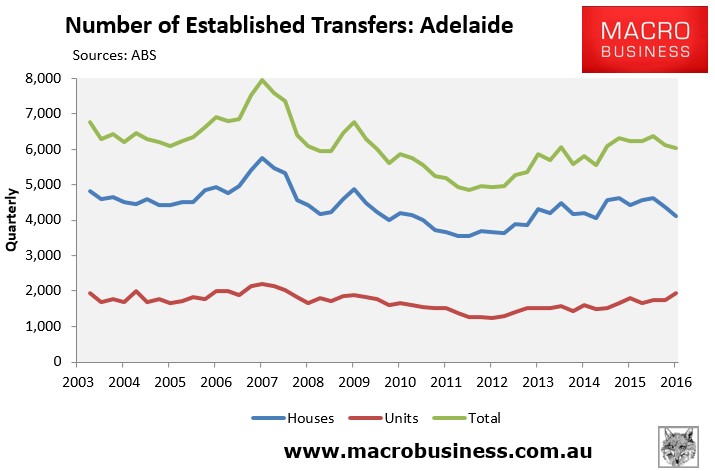
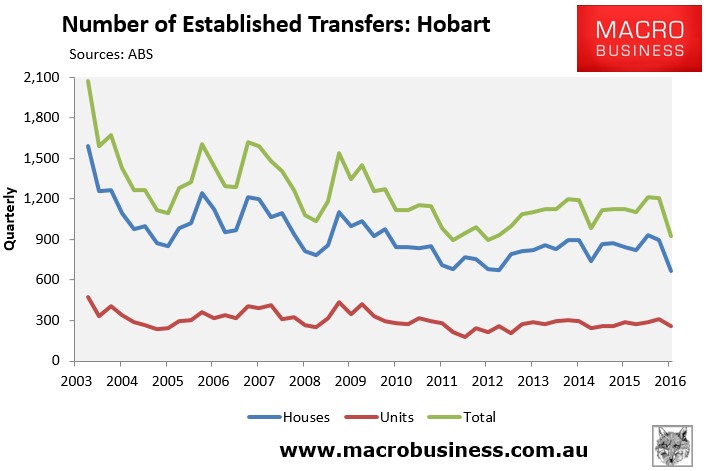
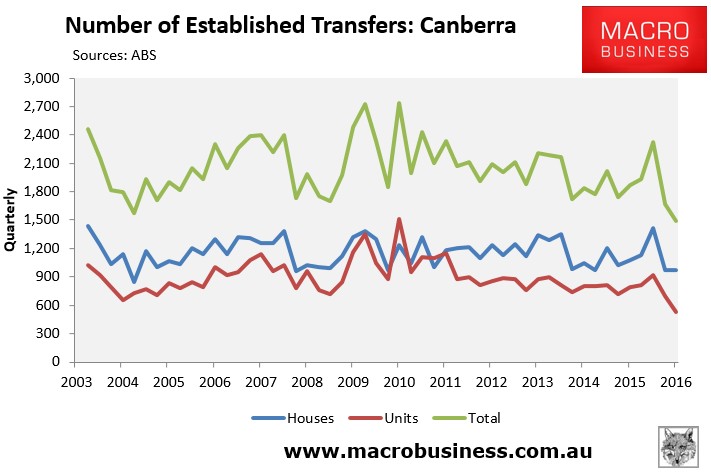
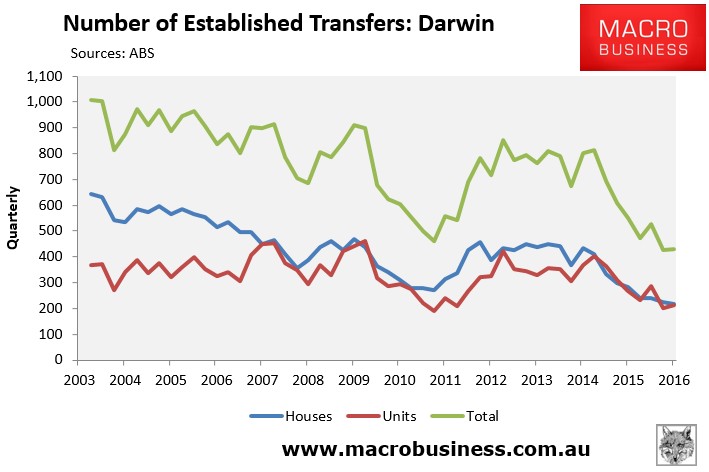
As shown above, transfer volumes have fallen everywhere over recent quarters, but particularly heavily across the Eastern capitals and the mining strongholds of Perth and Darwin.
Next, the below charts present the same data, but this time on a rolling annual basis:
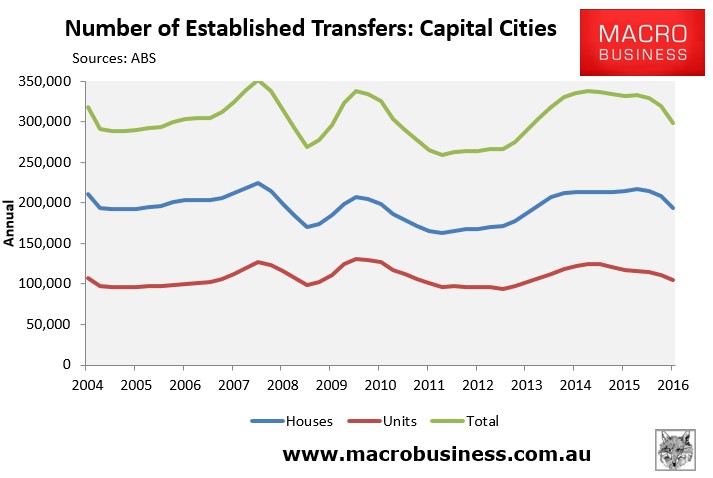
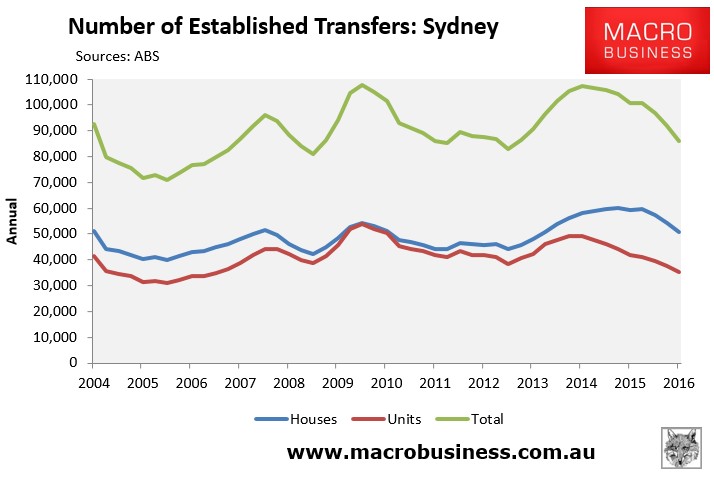
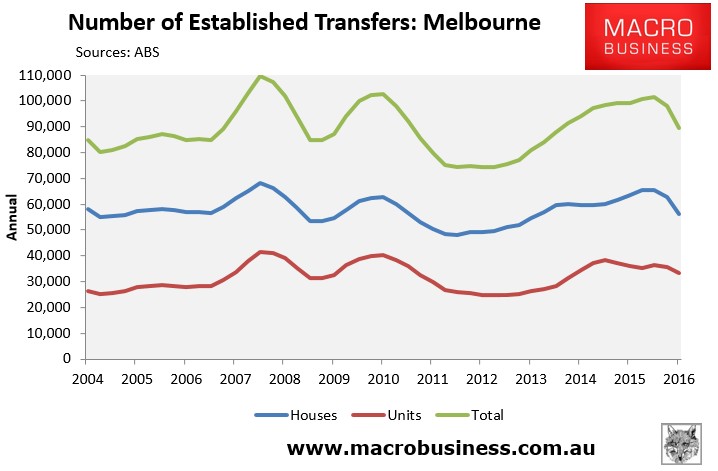
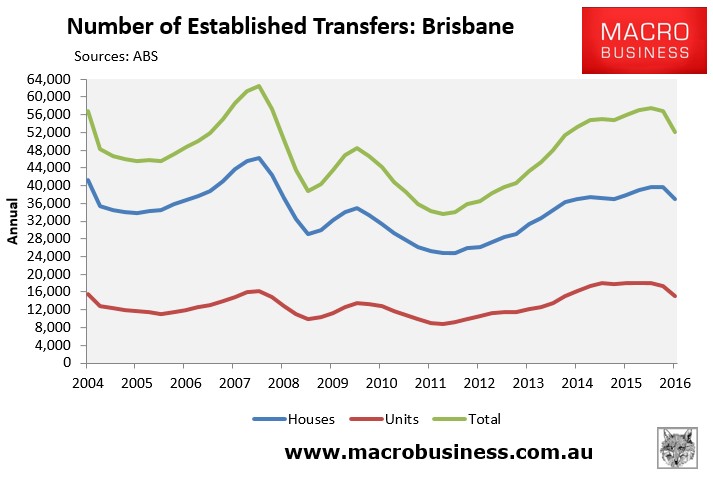
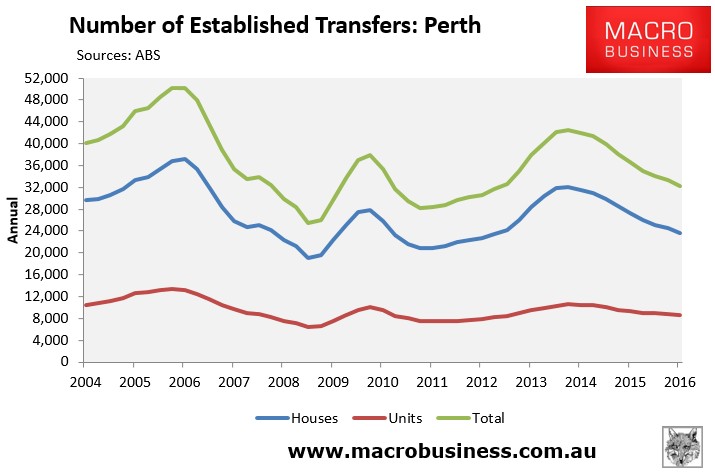
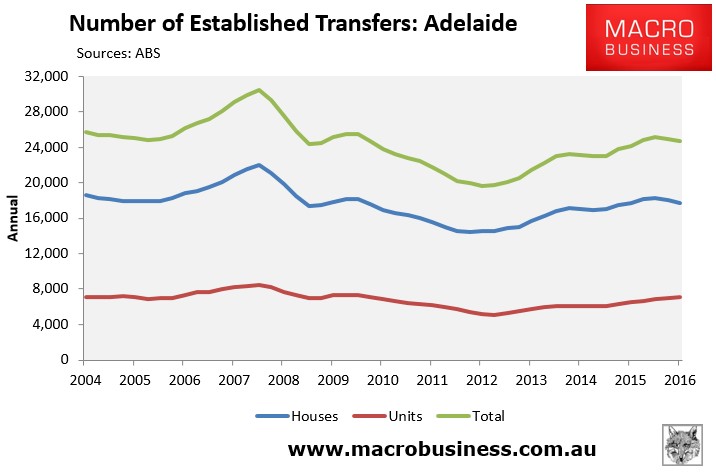
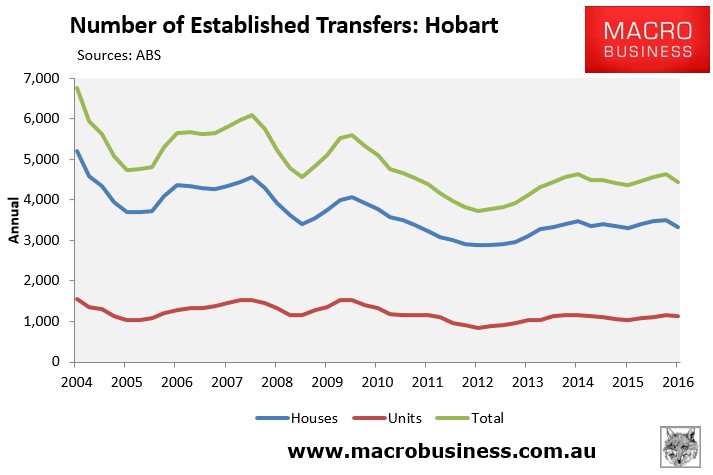
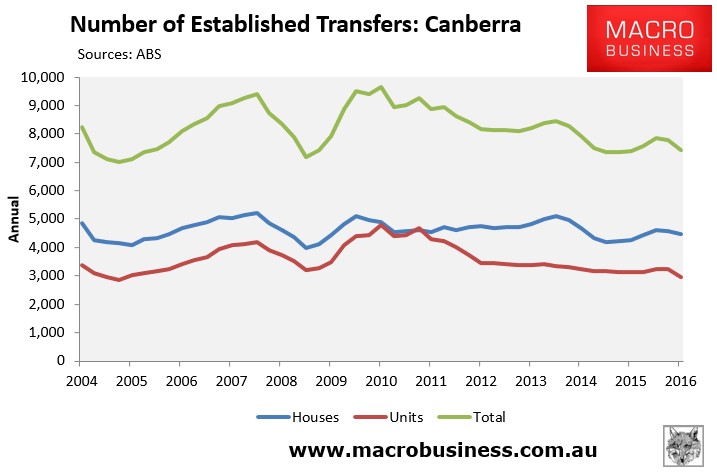
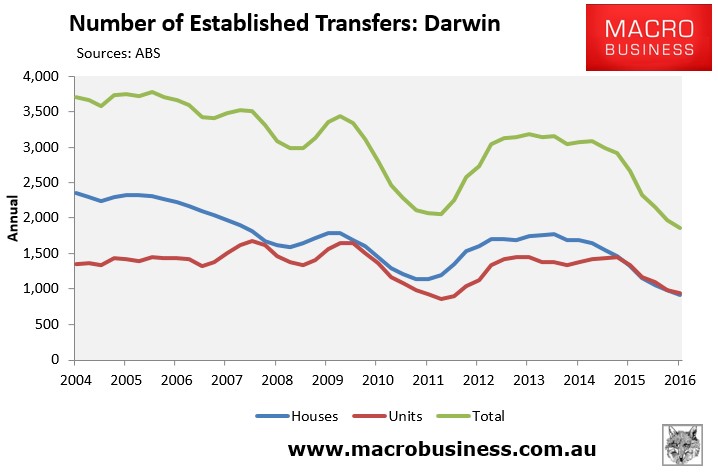
It’s much the same story, although the downturn in volumes appears less severe since it has only occurred over the past few quarters.
The tentative conclusion here is that falling transaction volumes do appear to have offset falling finance commitments, thus keeping prices elevated.
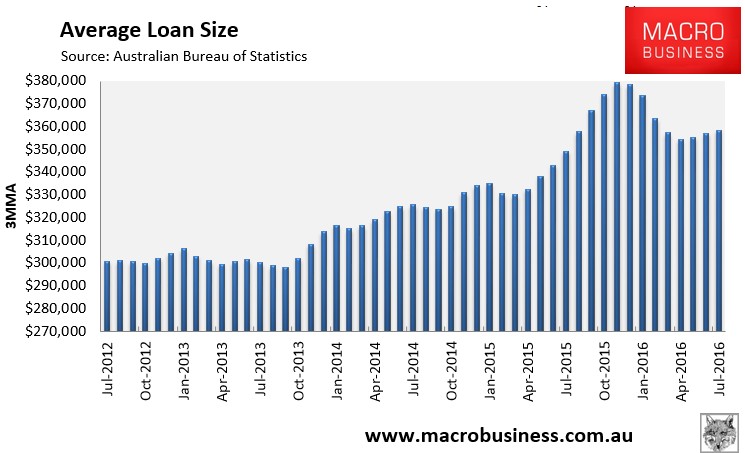
There is one wrinkle to this view, however, which is that average loans sizes have also fallen since late last year, which would normally suggest falling prices:
Nevertheless, changes in transfer volumes have historically been a good leading indicator of prices, at least for the major capitals:
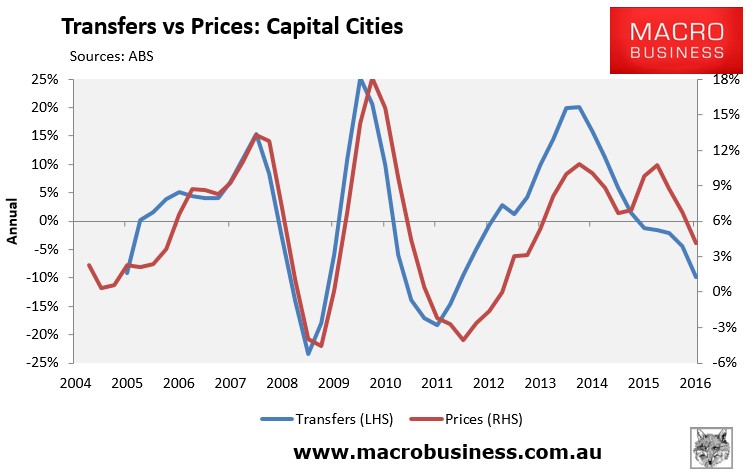
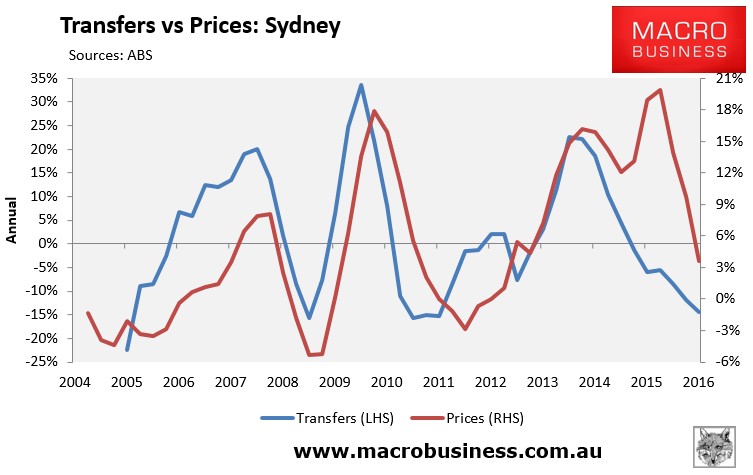
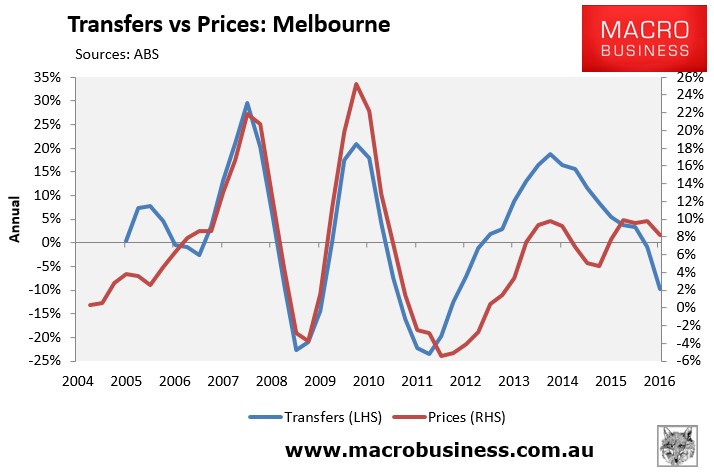
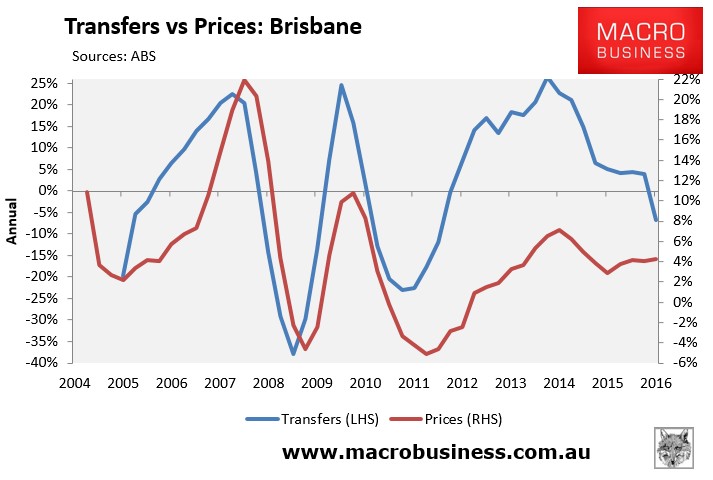
Thus, they are yet another indicator pointing to falling price growth.
The housing price boom that took hold of Australian property post-2011 with monetary easing is clearly finished in every major capital city (and region) outside of Sydney and Melbourne. In all, prices have either flat-lined or are falling since the last peak in real terms, chasing volumes lower. Even within the two major eastern capitals transactions have crashed suggesting strongly that the two are also experiencing a distinct narrowing in geographic price increases.
What was a national price support has now shrunk to a few speculative jurisdictions probably best described as the inner-city ring of properties in both cities, driven by population growth, low interest rates and possibly foreign buyers. This residual pattern of price growth has several implications.
First, it clearly makes the overall housing market more vulnerable to shocks given 60% of the Australian population is now seeing either real or nominal dwelling price falls or stagnation. Anything that disrupts confidence in Sydney and Melbourne will see the entire national market roll over quickly.
Second, the inner-city jurisdictions that are still seeing price support (stronger in Melbourne than Sydney) are often the very same areas where an historic supply response is underway. These booms are crucial to the economic activity and labour market supports in both cities – across the entire value chains of finance through to sales and construction – and are in part driving the housing demand. Thus, as the dwelling construction booms ebb in the next year or so they will combine to bring a double shock to both capitals as supply floods markets and economic activity simultaneously weakens.
Third, APRA’s prudential tightening is very likely finished and RBA is very likely to cut rates further.
Finally, it is impossible to know or to predict when (or even if) this strange market will collapse upon itself. The dynamics make it possible but the population growth and easy money supports are still there so it could limp along for a while.
What can be said with certainty is that the Australian housing market appears very vulnerable and any kind of external shock will hit it very hard indeed.
