
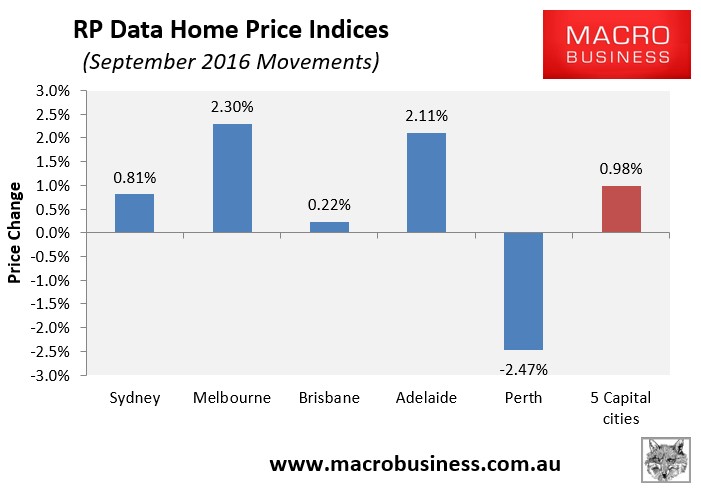
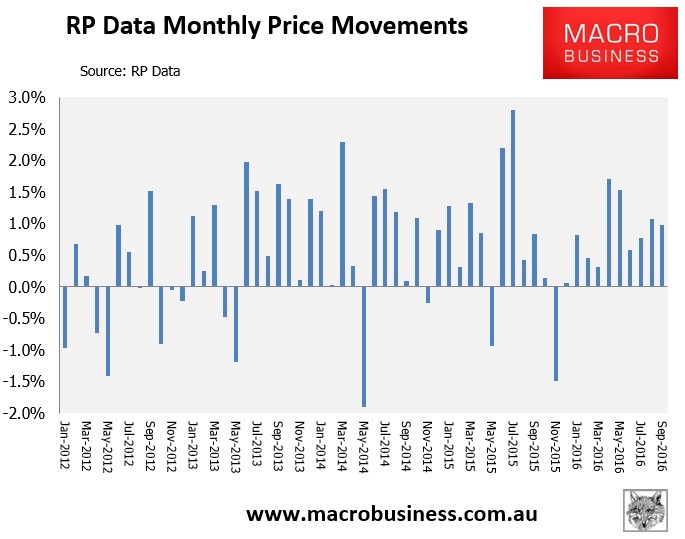
CoreLogic’s dwelling price results are in for September, with a 0.98% rise in values recorded over the month at the 5-city level (see next chart).
It was the ninth substantive monthly rise in home values in a row (see next chart).
Over the quarter, price growth was a hefty 2.86% at the 5-city level, up from the 2.45% recorded in August (see next chart).
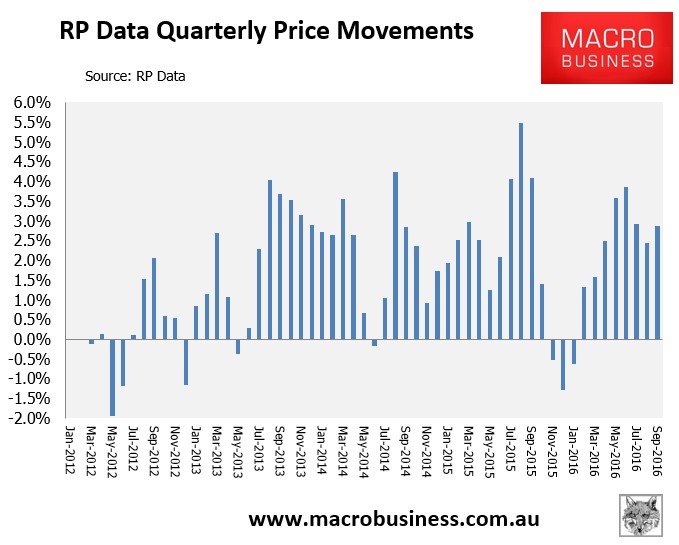
Over the quarter, values rose by 3.54% in Sydney and by 4.97% in Melbourne, and by 2.56% in Adelaide, but fell by 0.04% in Brisbane and by 3.16% in Perth.
The next chart, which tracks trend annual price growth, shows the second big rebound in annual growth has started to retrace yet again (see next chart).
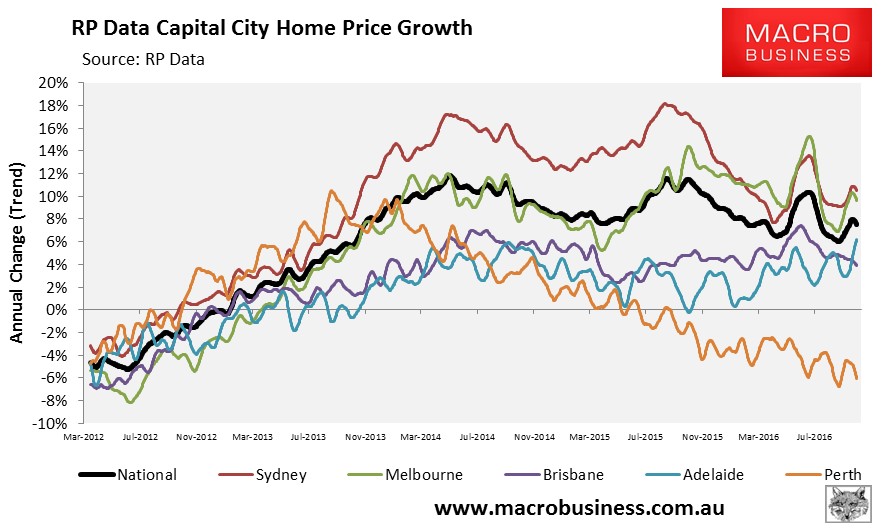
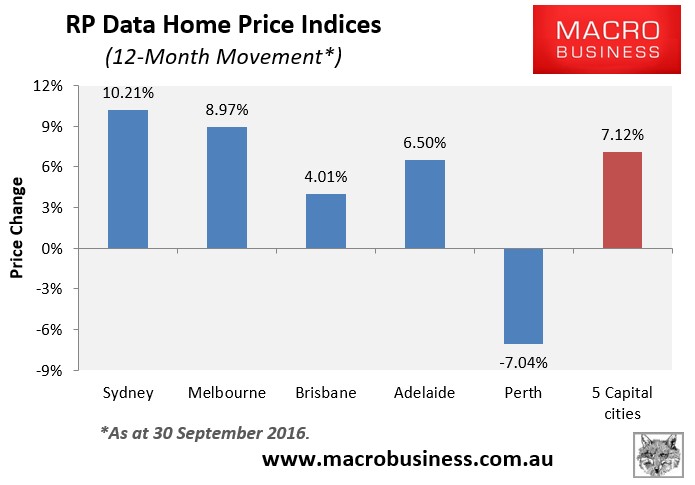
Sydney remains the strongest housing market in Australia when measured in annual growth terms, edging out Melbourne (see next chart).
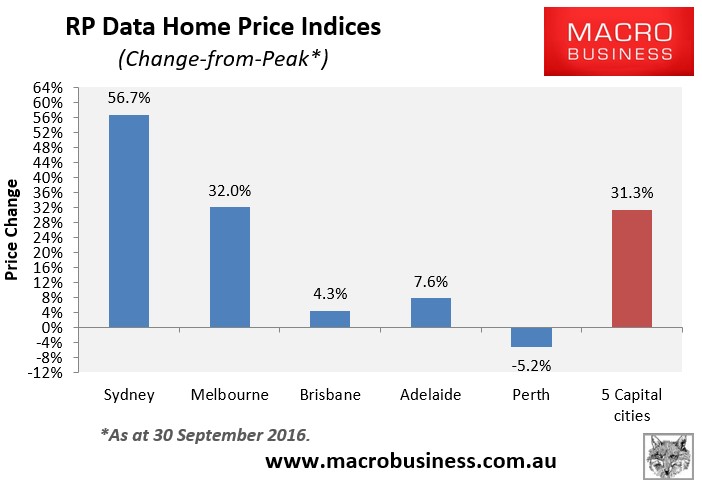
And values are now 31.3% above the October 2010 peak at the 5-city level, driven almost entirely by massive growth in Sydney (+56.7%) and to a lesser extent Melbourne (+32.0%), with the other major capitals not doing a lot (down in real inflation-adjusted terms):
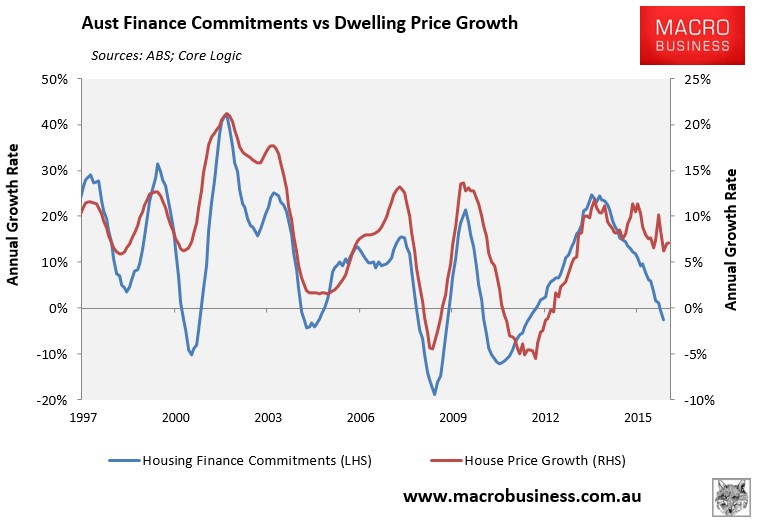
CoreLogic’s results continue to decouple from the ABS housing finance data, which shows a weakening trend (see next chart).
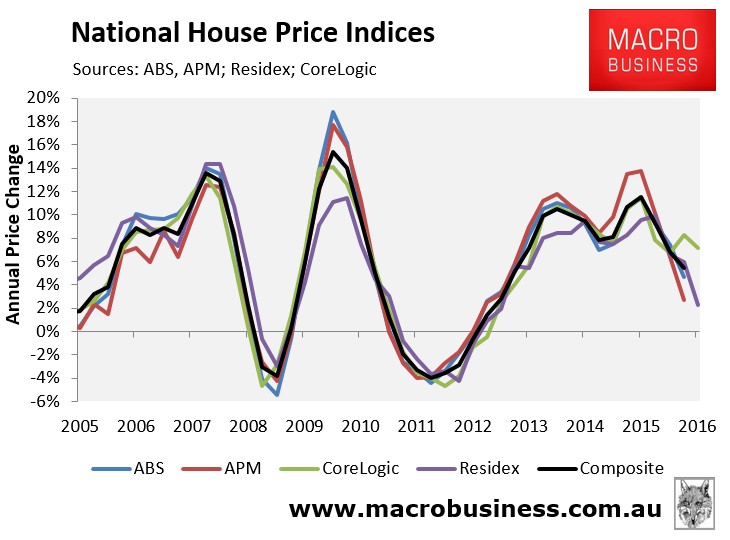
They are also at odds with the weakening trends reported by the other data providers:
Especially with regards to Sydney:
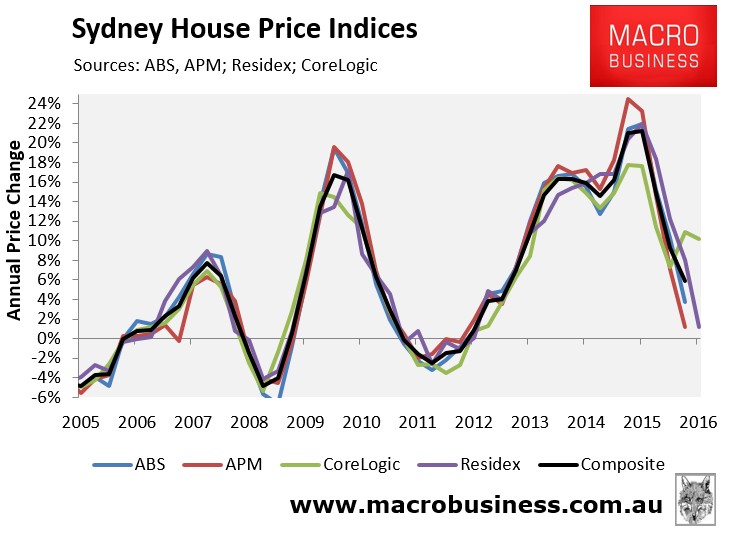
Thus, question marks remain over this index.
