
Cross-posted from Independent Australia:
Recently released ABS figures illustrate steady growth for agriculture over coal and gas. Lachlan Barker reports.
THE AUSTRALIAN BUREAU of Statistics (ABS) recently released their industry figures and those in the gas and coal industries will not want to read them.
It is really a story of graphs. As you can see, from the graph below on operating profit before tax, coal in the last financial year, showed a deficit of $3.9 billion. Profit from gas descended sharply and is approaching zero — more on gas below.

Source: abs.gov.au
However, agriculture has shown steady and improving returns to the Australian people since 2006-7.
So coal is in the biggest immediate trouble.
The price of gas and coal have both separately crashed and now we are seeing what many industry analysts have been trying to get through to the federal and state governments for some time now — coal and gas are dirty, polluting industries and are now financial dead ends.
As you can see on the graph, coal’s best times for profit were in 2008 and 2010-11, this coincides – of course – with the highest prices being received for this product. Thermal price chart shown here from IndexMundi:

Source: indexmundi.com/commodities/?commodity=coal-australian&months=60
However, oh, how times have changed. At the peak of 2008, Australian thermal coal was running close to US$200, while metallurgical (met) coal – used in the making of steel – was fetching a robust US$330 per tonne.
Currently, Australian thermal coal is fetching US$54.83 while metallurgical coal is running at around US$85-90 in the first half of 2016. Thus both prices have dropped to approximately a quarter of their peak price and thus we see clearly why the Australian coal industry is showing a figure of $3.9 billion in the red for the 2014-15 financial year.
What this will mean in the immediate term is difficulty for high cost producers, with likely closure of least profitable mines.
This has been best evidenced by the fortunes of Peabody, the world’s largest private coal miner. Peabody filed for bankruptcy protection in April this year.
Peabody operates nine mines in Australia currently – three in NSW and six in Queensland – and while Peabody has repeatedly said it is business as usual for their Australian operations, it is difficult to conjecture all nine mines lasting much longer.
As you can see here in their most recent quarterly report, Peabody’s Australian met coal was down 38 per cent year-over-year (YOY), while thermal was down 18 per cent YOY. Indeed it seems only some fortuitous sales out of their Wilpinjong mine kept their thermal numbers from being even worse.

So Peabody’s figures, there, highlight the general and calamitous drop in fortunes for Australian coal.
It seems the only thing that can help is the closing of unprofitable mines, which will tighten demand and give the most efficient coal mines a minor chance of survival.
And indeed these figures from Peabody and the ABS above, further highlight why opening new coal mines in Australia at this time is financial lunacy writ large — Adani and Shenhu please note.
So then we come to gas and here perhaps things may be illustrated better with the tabular data and not the graph:
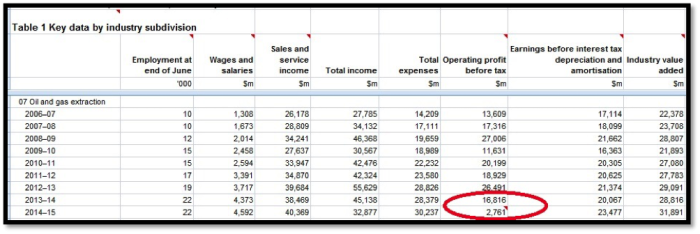
Source: abs.gov.au
Oil and gas’s operating profit lurched downwards a staggering $14 billion, again symptomatic of a crashed price. Liquefied Natural Gas (LNG) export prices are linked to the price of oil and the oil price came crashing down in late 2014.

Source: nasdaq.com/markets/crude-oil-brent.aspx?timeframe=2y
This crashed oil price is why we see the operating profit for oil and gas in Australia drop so dramatically. However, despite this drop we see that oil and gas’ Industry Value Added (IVA) is still reasonable, as shown here:

Source: abs/gov.au
Industry Value Added is the contribution to Gross Domestic Product (GDP), which the ABS defined as:
… the measure of the contribution by businesses in each industry to gross domestic product. The IVA table presents the estimates of the components of IC+VA for all industries that are within the scope of the collection.
Returning to the IVA graph you could be forgiven for thnking gas is still going strong, contributing to IVA — shouldn’t we forget coal and invest in agriculture and gas?
Well no, actually. Firstly, that contribution to IVA from gas is largely from Western Australia, where their offshore gas projects have been smoothly and up until recently, profitably, exporting LNG to overseas markets, shown here in the Resources and Energy Quarterly for December 2015.

As you can see approx two-thirds of our gas production is from the western market.
Now the Queensland onshore CSG-to-LNG projects at Gladstone have all come on line, all three of these projects have been hit by the crashed oil price and are currently loss-making.
So the next financial year figures – in 2017 – from the ABS may indeed show gas’s contribution to IVA hold steady as more producers come on line (Chevron’s Gorgon is an example). However, more producers selling less profitable gas is going to ultimately see operating profit go down, then closures and then gas’s IVA begin to descend with it.
This descent of the profitability of gas can be forecast because the oil price is predicted to sit in the US$40-60 band for the rest of the decade, so income will not increase but expenses will.
A good indicator of this is the expenses versus income graphs:

Source: abs.gov.au
Agriculture shows a steady return on money spent, while gas does not.
Once the loss-making Queensland LNG projects – now in full production – add their full output to these figures, the oil and gas expenses line on the chart is going to overtake income and Australian oil and gas for the next financial year will also show a coal-like descent into the red.
Finally, I’d like to once again deal with the employment issue and the short answer to that is if the current federal government really do care about ‘”jobs and growth”, then agriculture is what we need. Here is the employment chart of agriculture vs coal and gas:

Source: abs.gov.au
As you can see agriculture has been quietly and steadily employing 400,000 Australians over the time of the ABS survey. Coal employs one eighth as many people, while oil and gas employs a 20th of our workers on the land.
So in the end, while the gas industry in Australia constantly scream what a great contribution they are going to make to Australia’s export earnings, it is a false forecast and over the coming two years, gas will descend into the red and high cost producers like the onshore projects in Queensland will begin to close.
Coal likewise has to make some hard decisions and close unprofitable mines.
And finally, despite the rhetoric from the gas and coal industries, agriculture is far more ecologically and financially sustainable and key to Australia’s prosperity.
So let’s start acting like it, let’s preserve, cherish and protect our farm land and clearly closing coal mines and gas fields will help that for a start.
Which leaves us with this simple proposition, preservation and promotion of agriculture over gas and coal will see Australia infinitely richer in the end.
Lachlan Barker blogs at cyclonecharlie88.blogspot.com.au. You can follow him on Twitter at @cyclonecharlie8.

This work is licensed under a Creative Commons Attribution-NonCommercial-NoDerivs 3.0 Australia License
