
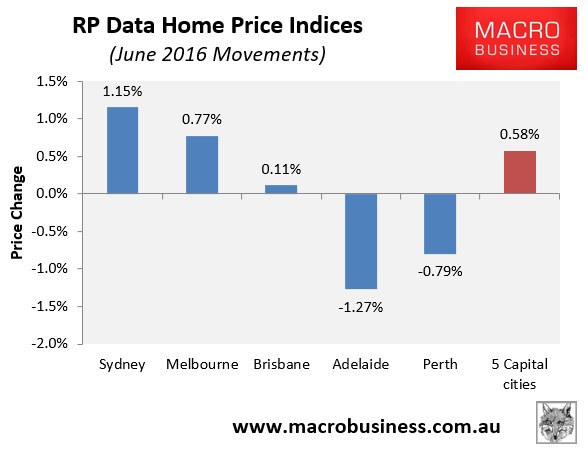
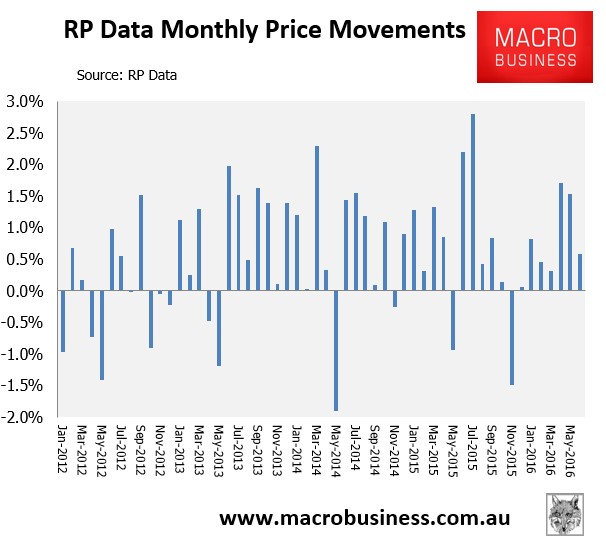
Core Logic-RP Data’s dwelling price results are in for June, with a 0.58% rise in values recorded over the month at the 5-city level, driven overwhelmingly by Sydney and Melbourne (see next chart).
It was the sixth substantive monthly rise in home values in a row (see next chart).
Over the quarter, price growth was a hefty 3.87% at the 5-city level – the highest rate of growth since September last year (see next chart).
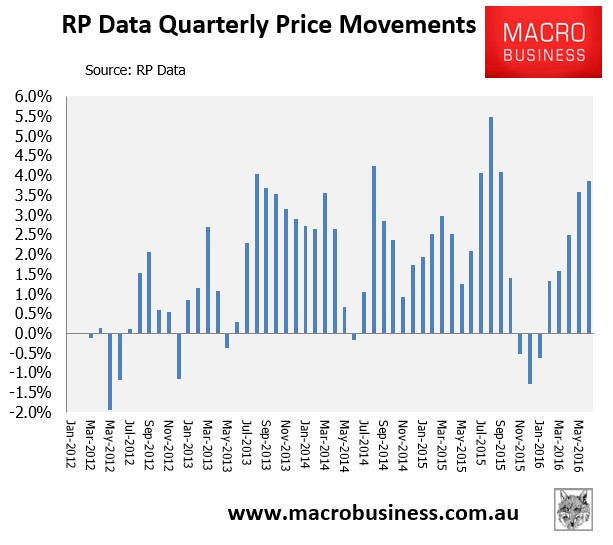
Over the quarter, values rose by an incredible 7.06% in Sydney, by 3.49% in Melbourne, by 2.03% in Brisbane, and by 0.72% in Adelaide, but fell by 2.58% in Perth.
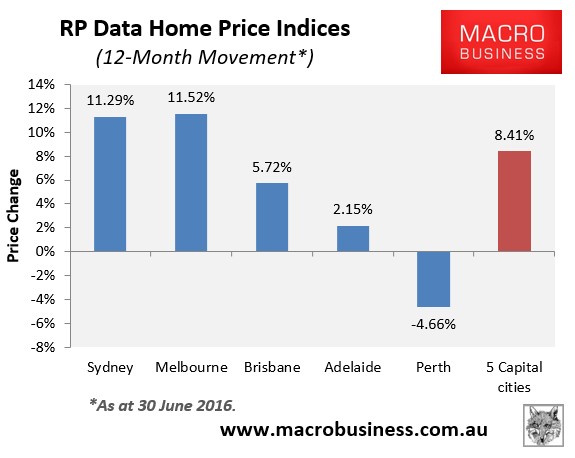
The next chart, which tracks trend annual price growth, shows that the big rebound in annual growth has begun to reverse (see next chart).
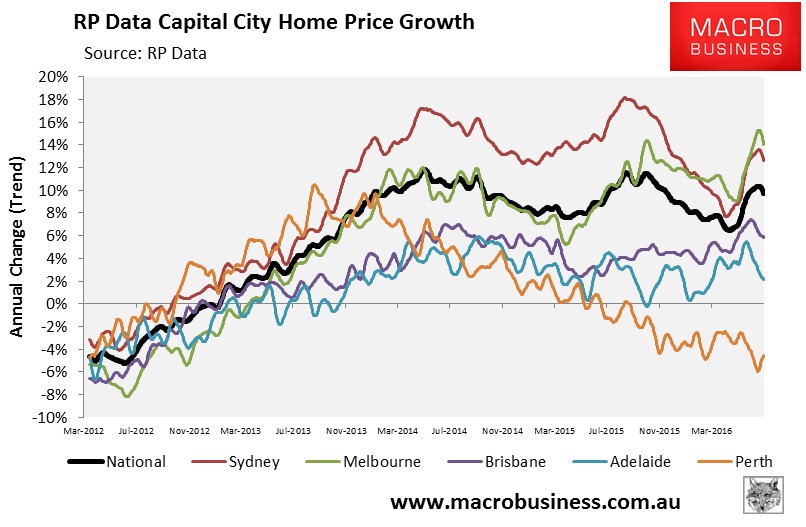
Melbourne remains the strongest housing market in Australia when measured in annual growth terms, narrowly edging out Sydney (see next chart).
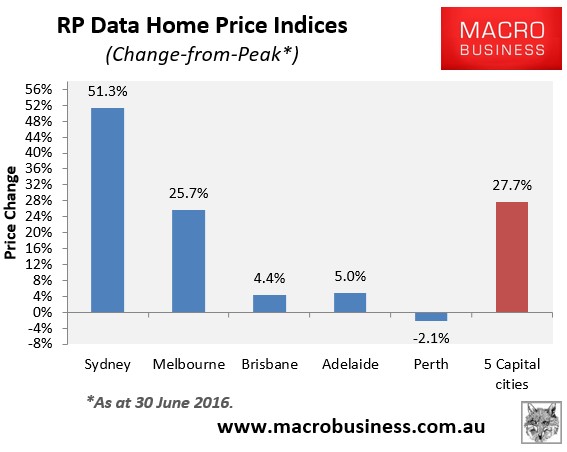
And values are now 27.7% above the October 2010 peak at the 5-city level, driven almost entirely by massive growth in Sydney (+51.3%) and to a lesser extent Melbourne (+25.7%), with the other major capitals not doing a lot (down in real inflation-adjusted terms):
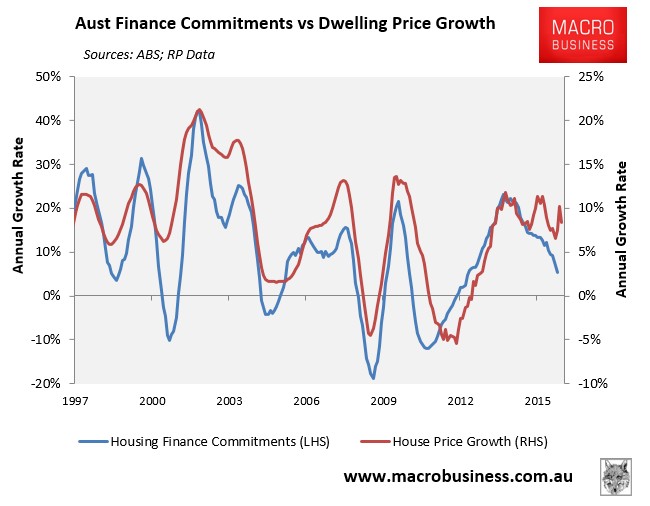
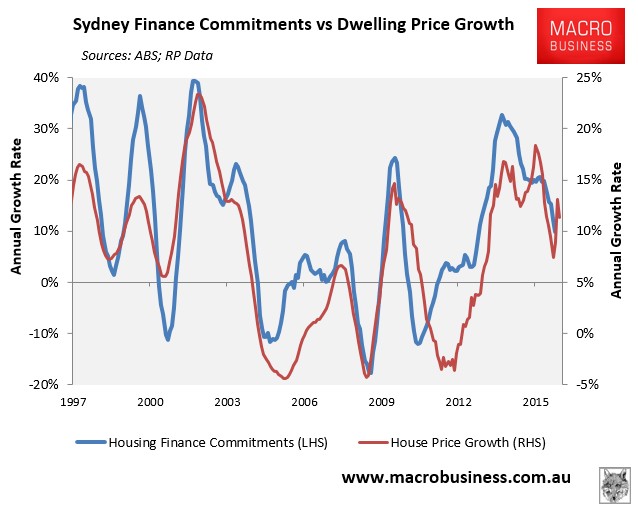
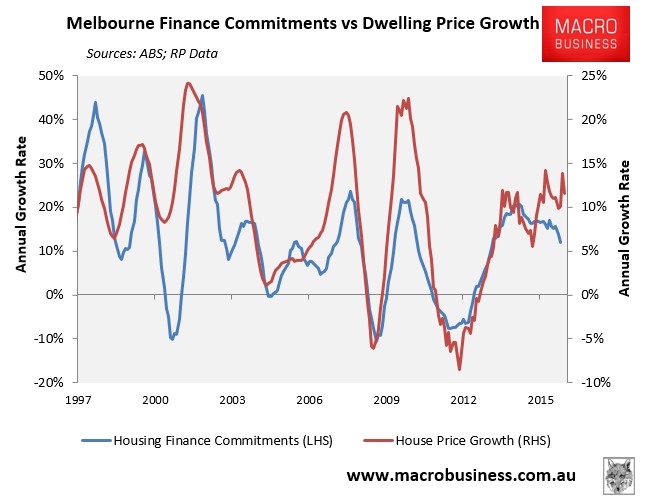
To date, Residex – which has released house price data up to May 2016 – has not recorded any meaningful pick-up in price growth, particularly in Sydney. RP Data’s results are also at odds with the ABS housing finance data, which shows a weakening trend (see below charts).
Hence, I am not sure about the veracity of these results.
