Special report: Measuring China’s resurgent construction boom
Readers will recall that MB has been skeptical that China would be able to resuscitate its construction boom given three-quarters of it is based in third and fourth tier cities where house prices are still flat and falling owing to huge oversupply. As well, the CCP has declared that real estate “destocking” is a major national priority and in its 13th Five Year Plan has wound back its urbanisation plans for population movement.
The evidence over the first quarter is in for national Chinese construction statistics and, for now, the ‘can kick’ is on.
Construction starts have opened up the year with a bang up 19.2% year on year for the quarter. If we compare starts for the first quarter with past years we’re on track for -3% from 2014 starts (red line):
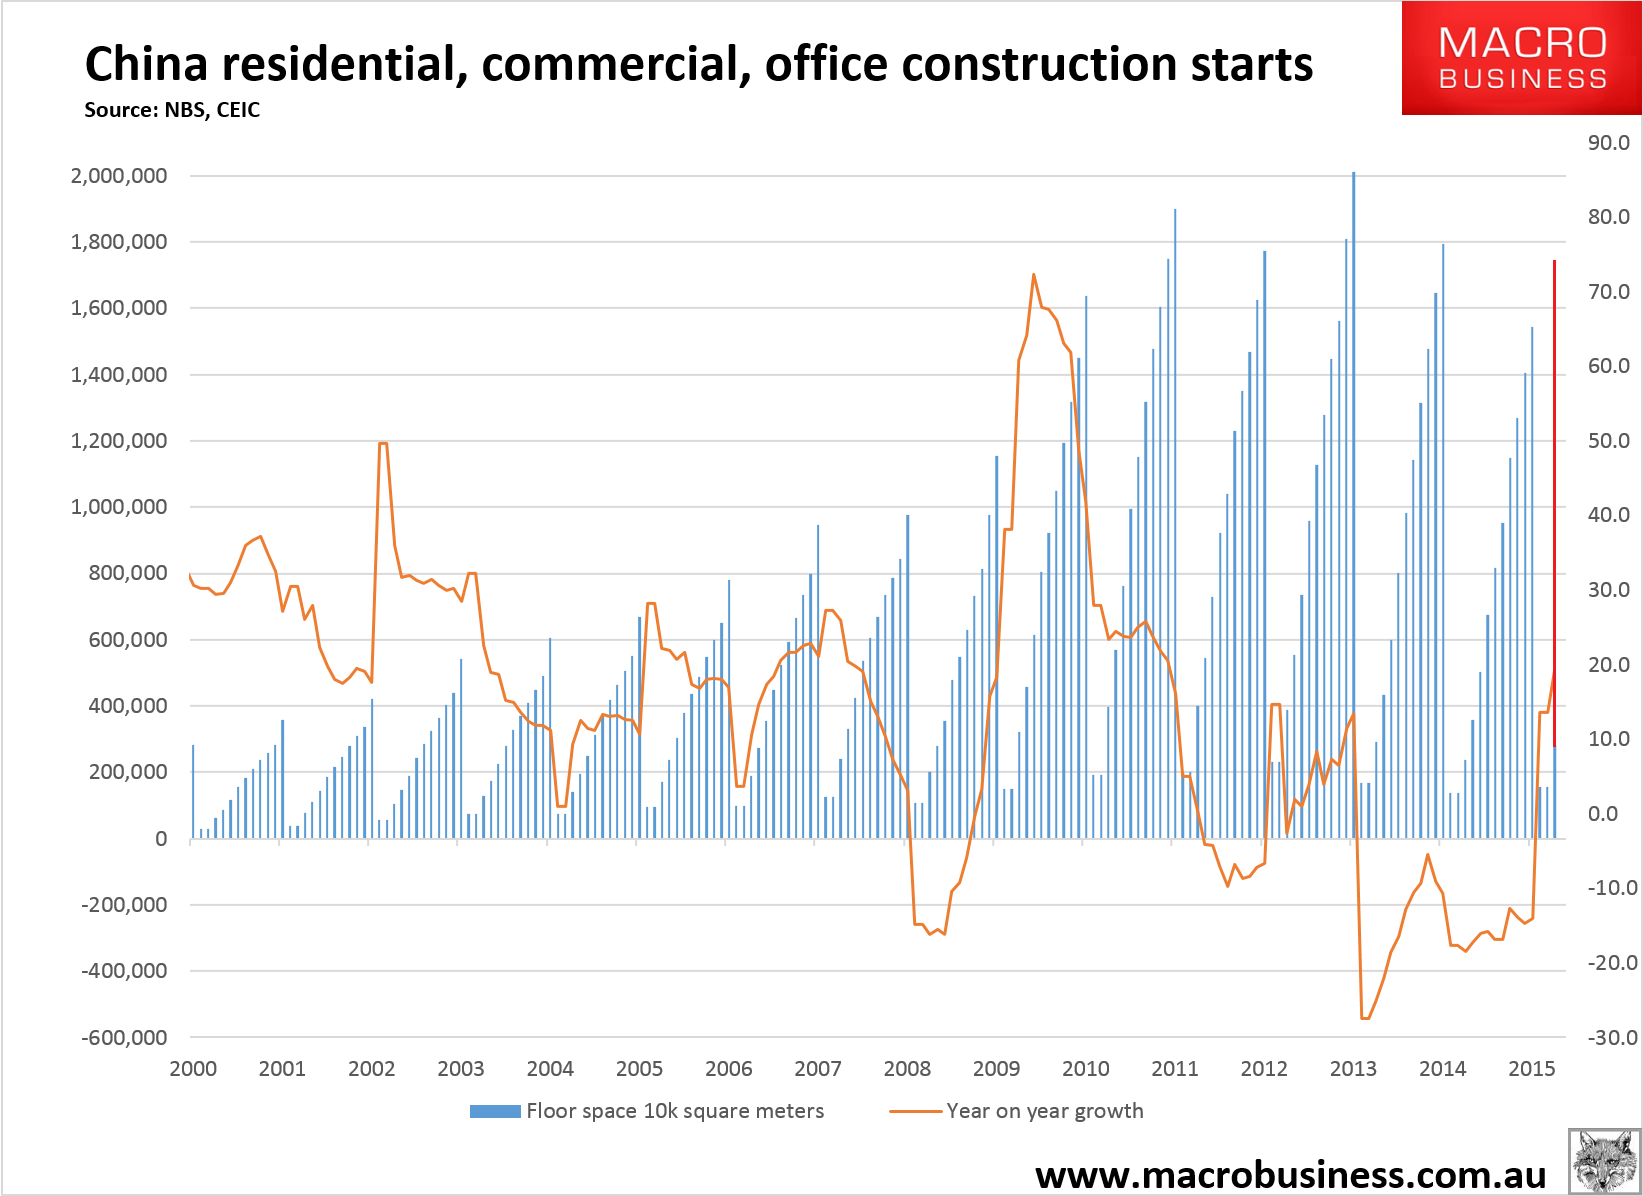
As you can see, it does not disrupt the downtrend but slows it considerably.
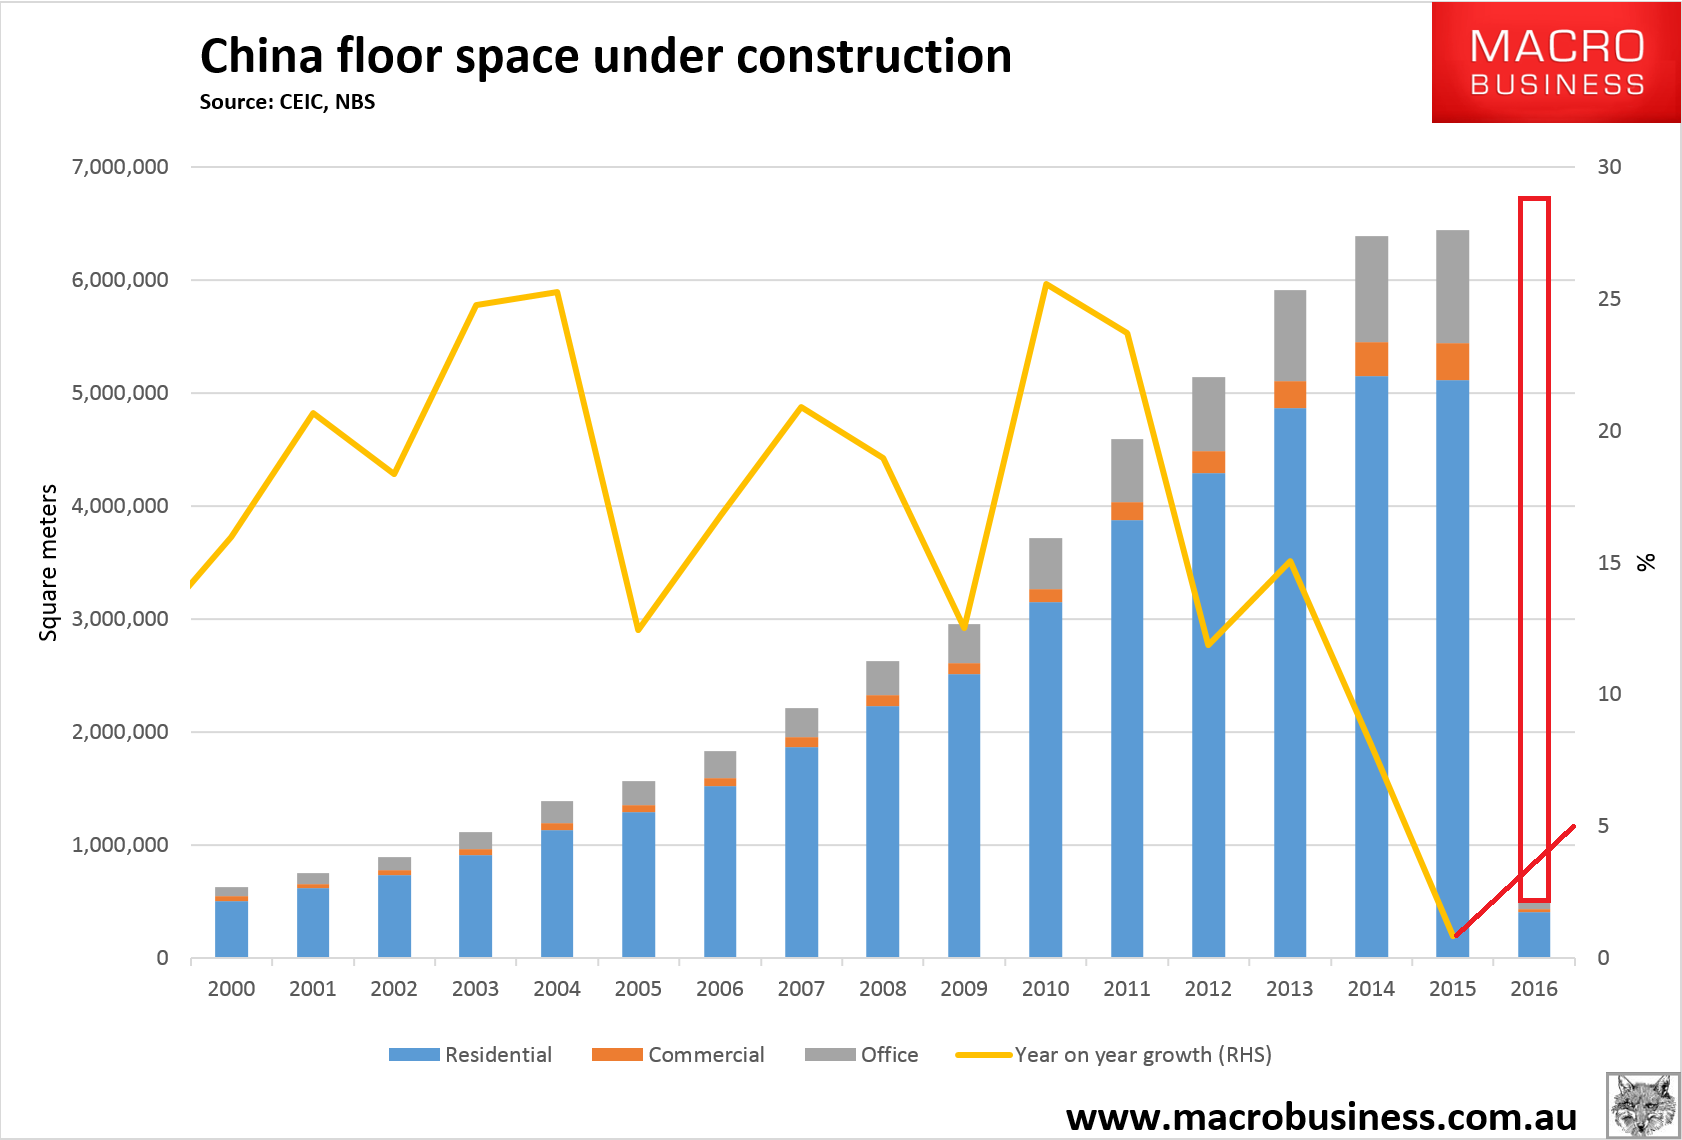
That’s flow. Turning to stock, the rebound in starts is strong enough to push total floor pace under construction up 5.1% in the first quarter. I’ve extrapolated what that would look like annualised in red below:
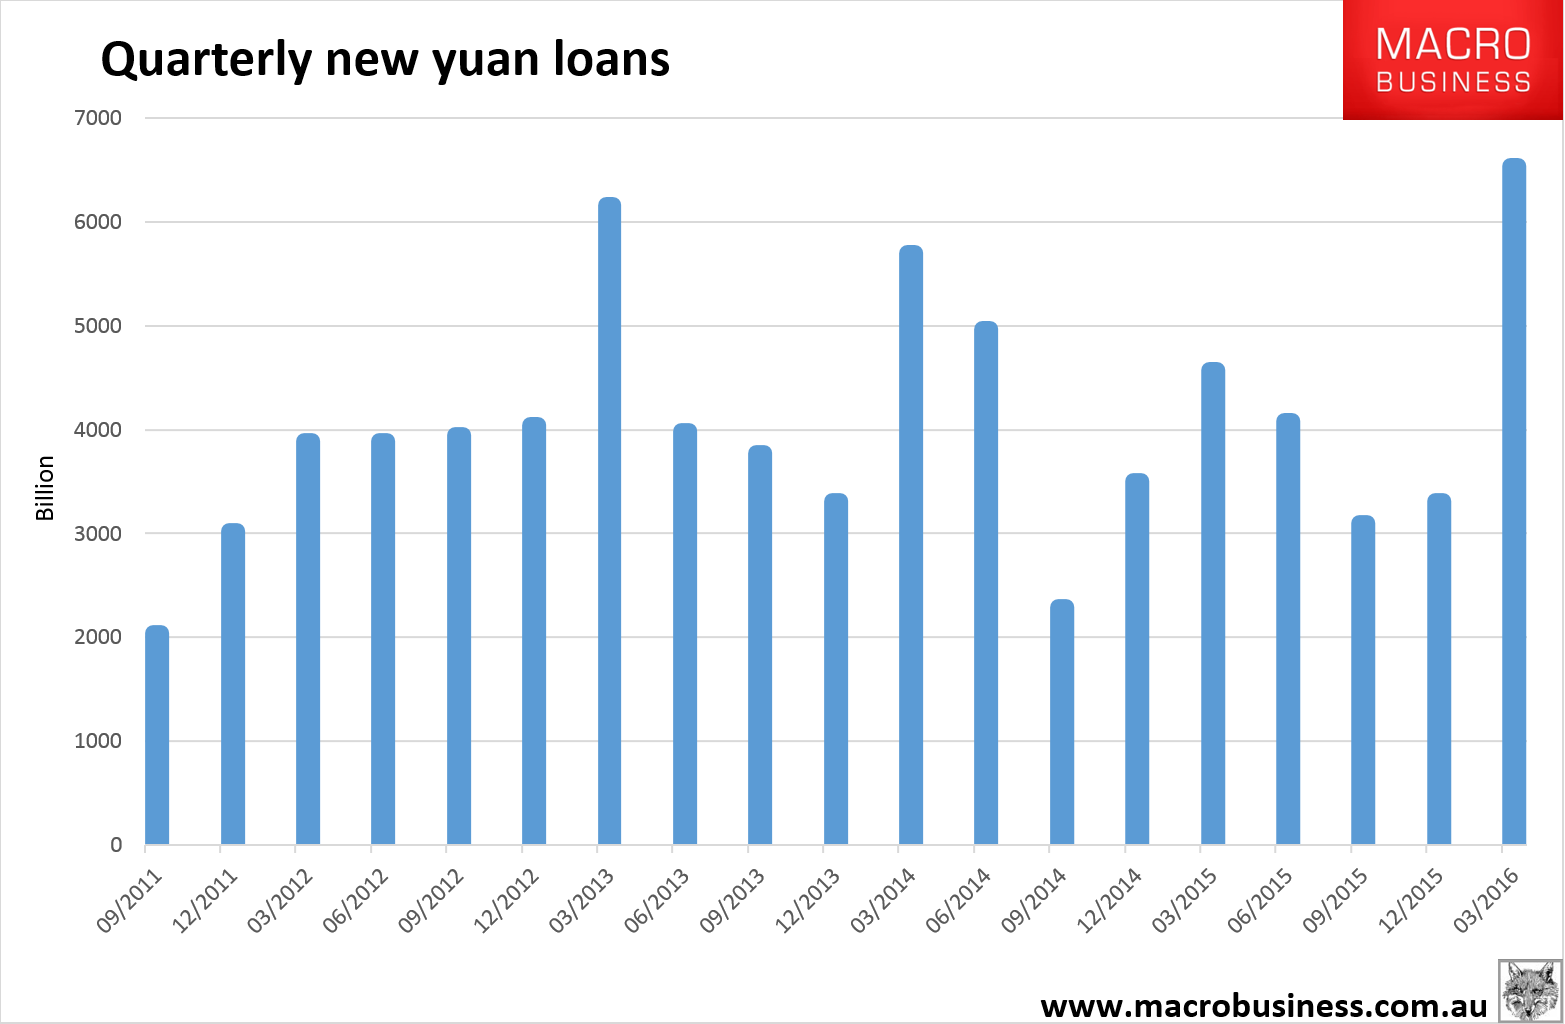
It’s not hard to find what is driving the surge in construction. New yuan loans rocketed in the first quarter to their highest level on record:
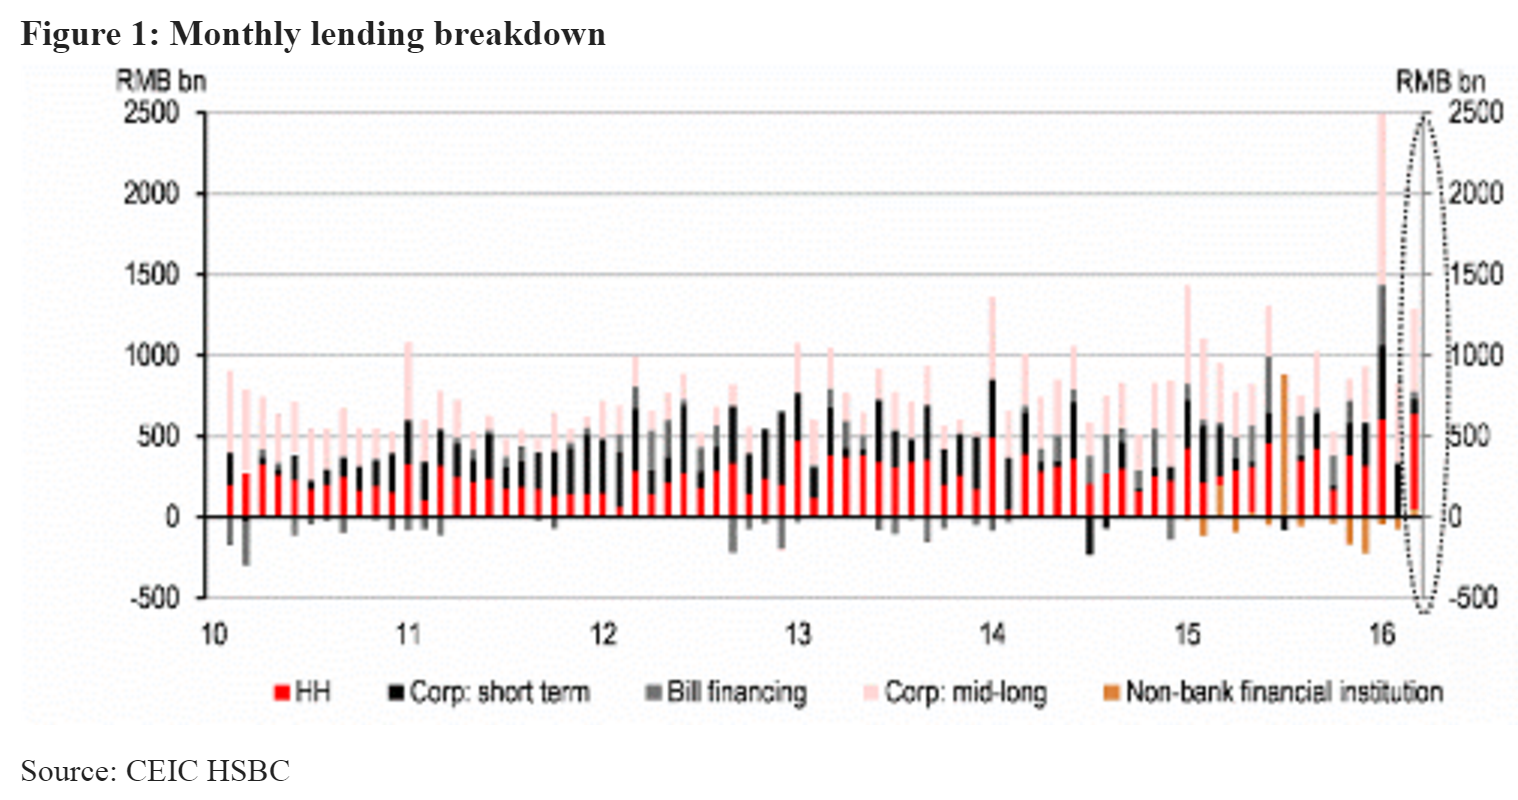
A lot of the lending was to households and corporates, though some of the latter will be repatriated US dollar loans as the yuan devalued in Q1, from HSBC:
So, how big is the surge and how far will it run? There are good reasons to view this as another ‘can kick’ within the broader context of an ongoing glide slope to lower and less credit-intensive growth. If that framework were abandoned then the CCP would risk a much more serious debt crisis and fast devaluing yuan that could prove an existential threat to its leadership. Societie General has more
In our view, the most obvious underlying factor behind this recovery is credit. In Q1, increases in total credit exploded to CNY7.5tn, up 58% yoy and equivalent to 46.5% of nominal GDP – one of the highest ratios ever. Credit growth accelerated to 15.8% yoy to end-March, the quickest pace in 20 months.
March credit data were much higher than expected. New yuan loans increased to CNY1,370bn (SG CNY1,200; cons. CNY1,100) and total social financing also delivered a solid print of CNY2,340bn (SG CNY1,500; cons. CNY1,400). Considering also the record swap amount of CNY776bn local government debt into local government bonds, total credit to the non-financial sector actually increased nearly CNY3tn last month. The strength in non-bank credit came first and foremost from the corporate bond market. Net issuance there was a record CNY695bn in March. Corporate bond issuance has been strengthening all the way after the NDRC relaxed issuance rules for local govt financing vehicles (LGFVs) in spring last year. In March, more than a quarter of corporate bonds were issued by LGFVs, which supported the acceleration in infrastructure investment.
There is no bigger policy lever than this kind of credit injection. The Chinese government was clearly giving growth all the attention in Q1, and now the question is how long it will maintain this undoubtedly unsustainable model.
And UBS:
China’s unique features such as high saving, government ownership and capital controls do not mean China can run an ever-increasing debt forever without major problems, but the problems may not manifest in a banking crisis or currency crisis. The fact that debt is rising much faster than output and an increasing share of debt is allocated in nonproductive or excess capacity sectors means resources may have been wasted and more potential bad debt are being created. Eventually, such costs will have to be borne by the financial sector and eventually by savers, asset prices will have to correct, corporate profitability may be depressed, and future growth will be hurt.
How might China’s debt problem play out? Below are a few possible scenarios
1. If China is lucky, the government’s strategy of allowing continued credit expansion and additional fiscal stimulus to buttress growth, and using pro-growth reforms to help unlock new and non debt-intensive sources of growth at home is helped by strong recovery in global demand. In such a case, China can basically grow out of the debt problem, much like it did over a decade ago.
2. More realistically, China may not be so lucky with global environment or domestic growth. The government would have to balance the need to stabilize growth and manage the degree of credit expansion, take actions to gradually restructure the stock of debt including by writing off bad debts and close down “zombie” companies as an indispensable part of the reform, so that while short-term growth may be weaker, long term growth and debt dynamic would be more sustainable.
3. The risk is that in an environment of lackluster global growth, the Chinese government is slow to carry out debt and corporate restructuring, instead relying more on using leverage, with the help of financial deregulation. In which case, short-term growth may be supported but the underlying debt problem will worsen.
The risk of a more disruptive break in the credit cycle rather than a drawn out process have increased recently, as Chinese policy makers have pushed for greater financial liberalization and RMB internationalization. As such liberalization takes place, controls that China has traditionally held over the financial system, a key to defying the typical credit cycle so far, will likely weaken. Reinhart and Rogoff in their book “This Time Is Different” showed that globally, chances of a banking crisis occurring typically rise following financial liberalization and capital account opening. China’s own experience clearly shows that it is much harder to exert controls on its capital and shadow credit markets than on its traditional banking system.
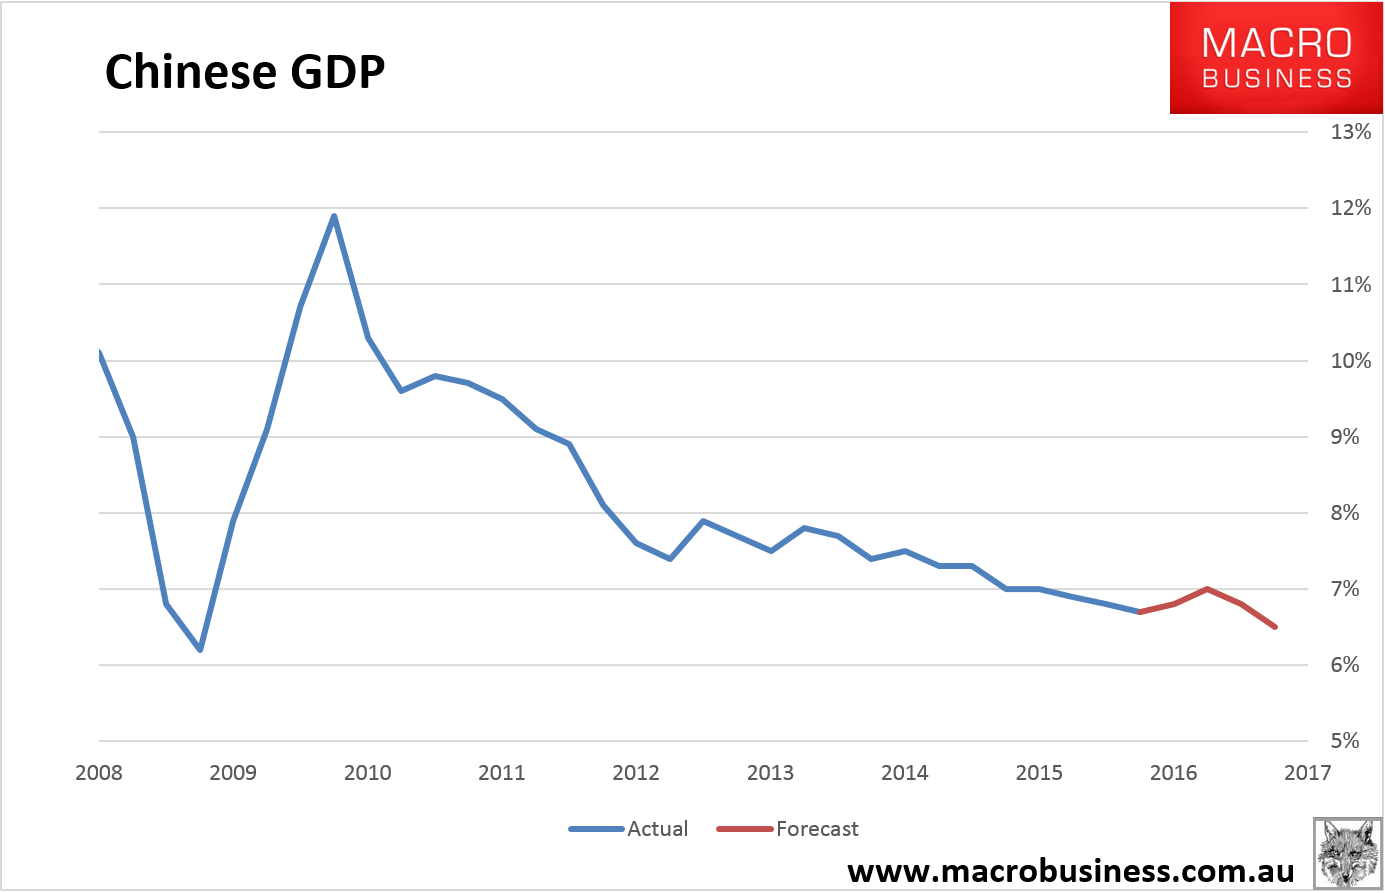
Chinese leadership has already shown its itself to be congnisant of these risks so MB remains of the view that this is another short cycle upswing within the larger glide slope, a pattern which has been repeated three times since 2011:
Second, authorities have already moved to dampen the out-of-control price bubble in tier one and two cities. Using macro-prudential tools, they’ve knocked out a major pillar in the credit surge which was innovation in lending that enabled borrowing for mortgage deposits, the mother of all bad ideas.
Third, lower tier city gluts remain real and enormous and if top tier city price growth slows, as it ought, then clearing that excess will slow too. And remember, three-quarters of Chinese construction is in the lower tiers.
Fourth, the granularity of China’s National Bureau of Statistics (NBS) construction data needs to be taken with a big grain of salt. How do we reconcile a concurrent surge in credit and housing starts? Where’s the lag? The data is sure be the result in part of planning targets, not what’s actually happening on the ground. The NBS data is still useful in terms of trends.
In sum, the best analogue to offer for the year ahead is some kind of rerun of 2012 when the Xi regime first came to power and pressed the growth accelerator for a short period. At that point, the full range of Chinese cities were still building like mad out of the 2009 stimulus so the repeat will not be as strong.
Returning to our top two charts, it is therefore fair to surmise that we’ll see new starts lower than the projected Q1 annualised growth as the above four factors drag on the surge through the year. Same goes for the stock of floor space. The best guess is that the outlook has shifted from what was a downdraft in construction in the -5 to -10% range a few months ago to a -5 to 0% position today. It’s still a material change.
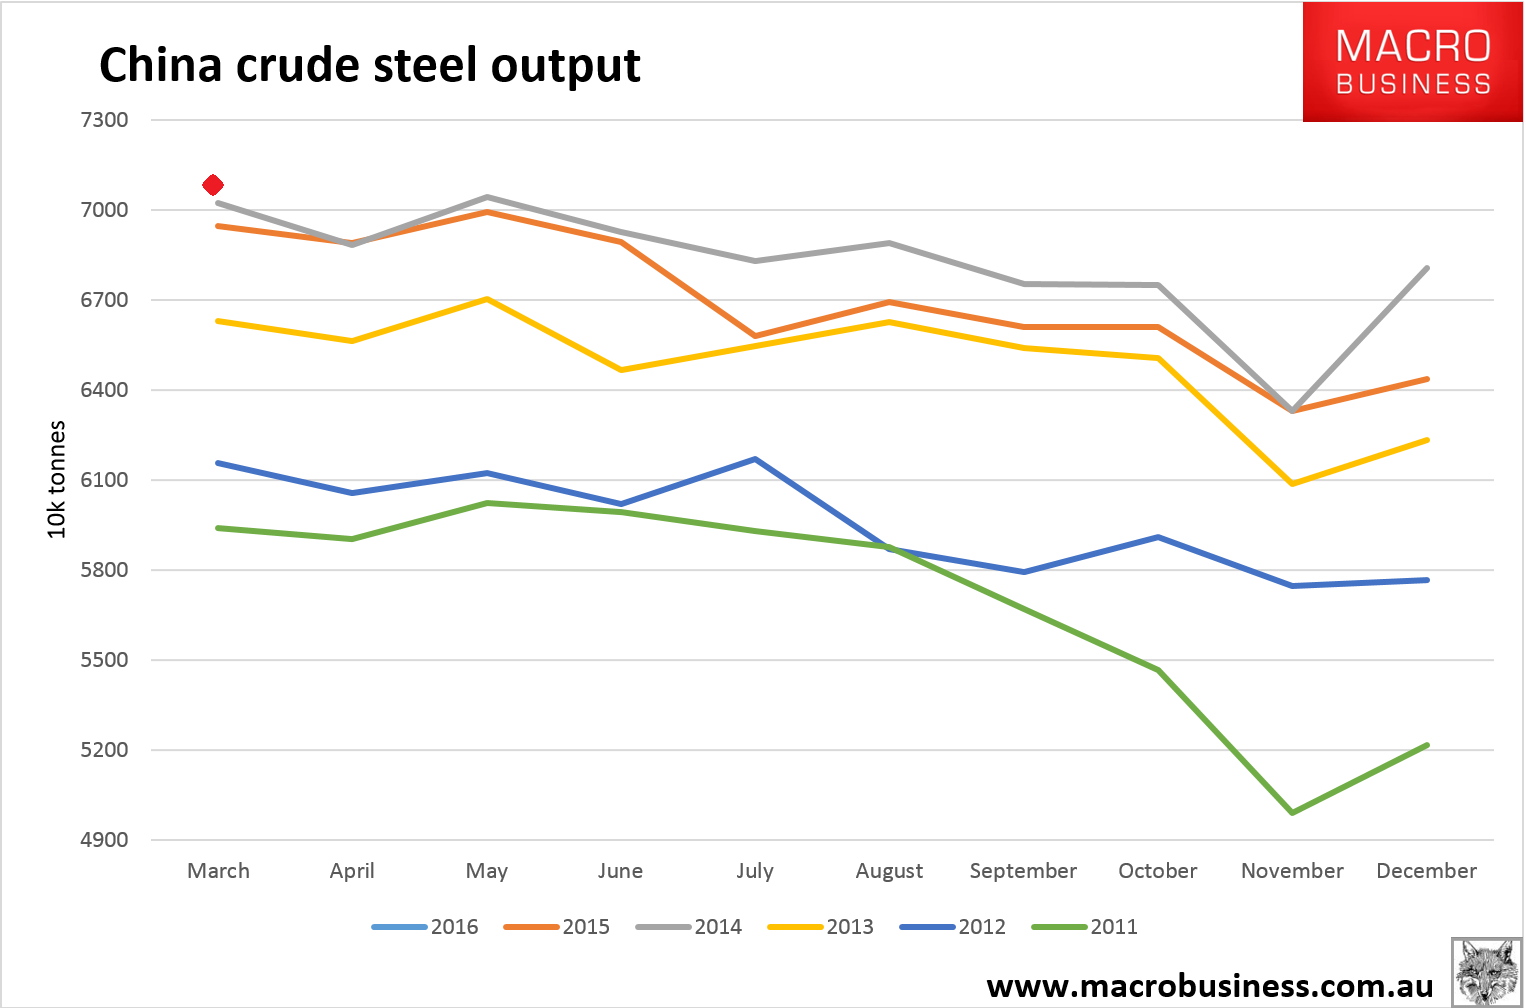
So, what does it do to steel output? The NBS records first quarter output being down -3.2% year on year, at least gesturing at the big falls we’ve seen in the CISA fast data for major steel mills. But for March alone, official output reached a record high at 70.65 million tonnes (see the red diamond):
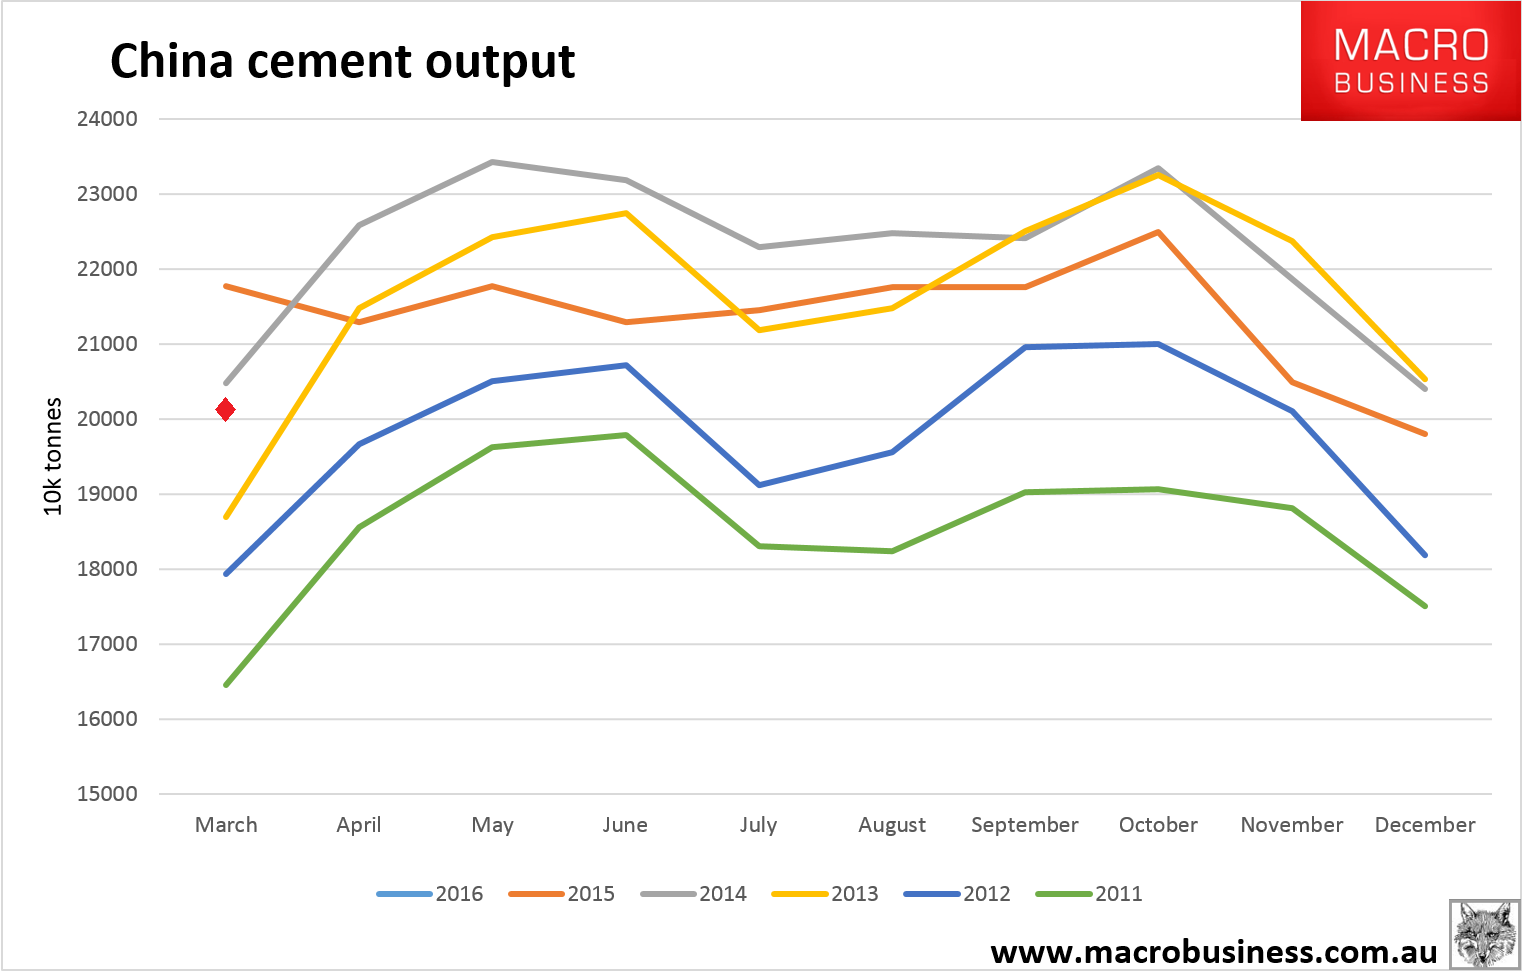
We know that steel mills and traders have been caught short by the swift swing to growth so some of this is restocking not underlying demand but it is strong nonetheless. This assessment is supported by cement output which has had a less auspicious start to the year, hovering below 2014 March levels (see the red diamond):
We have to add the filling infrastructure pipeline to our calculations too but that is less steel-intensive and smaller than housing construction (20% versus 50% of steel consumption) so it will add at the margin. The upshot is that Chinese steel output is going to fall less than MB supposed a few weeks ago, at a guess in the range of -3% to 0 which would equate to -20 to 0 million tonnes and, in iron ore terms, -30 to 0 million tonnes.
It’s a big improvement on where we were and enough to support an iron ore price average of $45 for the year: Q1 $45, Q2 $50, Q3 $45, Q4 $40. Thence down again next year.
