
The Reserve Bank of Australia (RBA) has released its private sector credit aggregates data for the month of January:
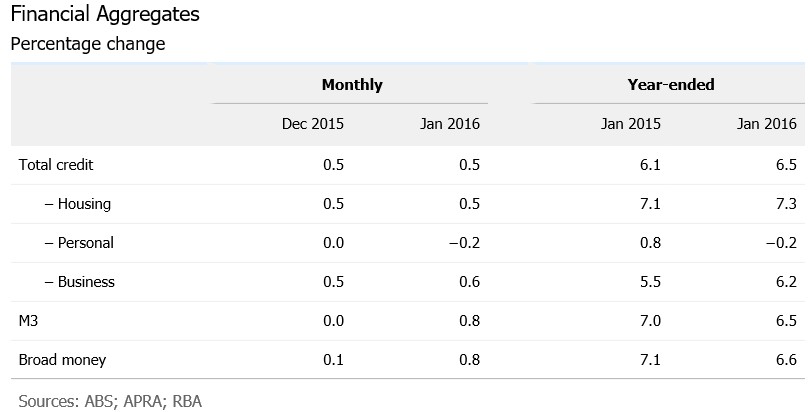
A chart showing the long-run breakdown in the components is provided below:
Personal credit growth (-0.2% MoM; -0.3% QoQ; -0.2% YoY) is in the gutter, whereas business credit growth (0.6% MoM; 1.1% QoQ; 6.2% YoY) has firmed. Housing credit growth (0.5% MoM; 1.7% QoQ; 7.3% YoY) is stronger again, but remains below its long-run average growth rate (although in dollar terms it is near the highest on record – see below).
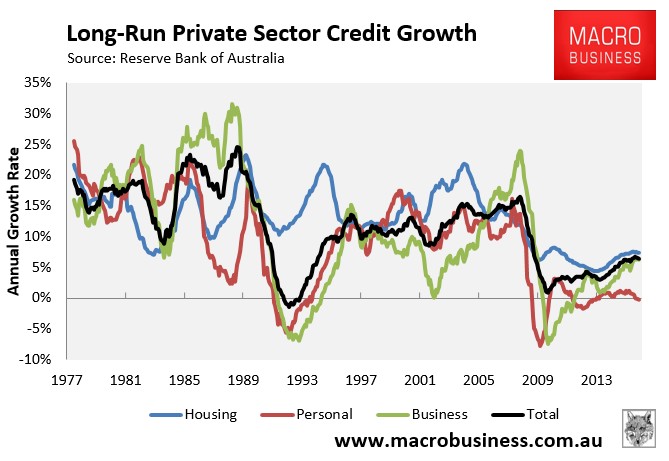
The below chart shows that quarterly housing credit growth continues to fall:
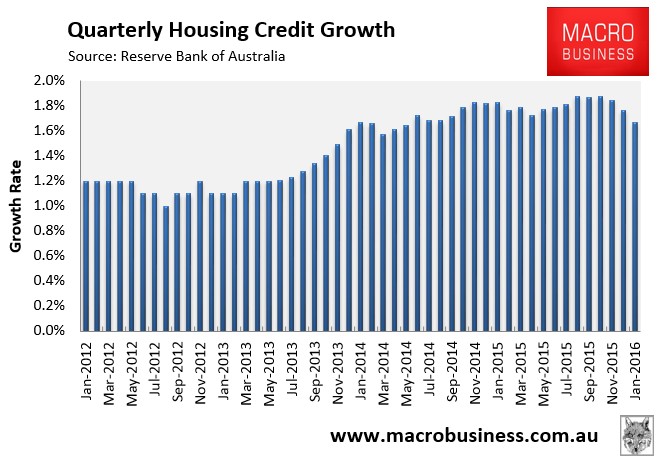
A long-run breakdown of owner-occupied credit (0.60% MoM; 2.07% QoQ; 6.95% YoY) and investor credit (0.32% MoM; 0.96% QoQ; 7.88% YoY) is provided below:
For more than three years, the lion’s share of mortgage growth has come from investors, leaving owner-occupied demand in its wake. However, investor credit growth is now slowing fast, whereas owner-occupied credit growth is rising, which suggest that APRA’s and the banks’ macro-prudential tightening against investors is starting to bite:
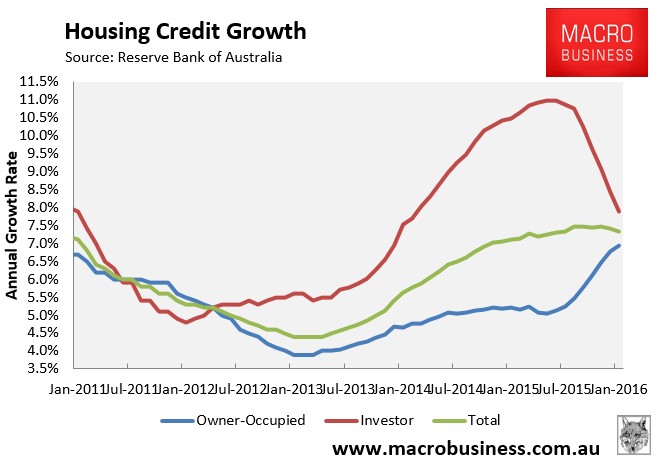
Alternatively, given the sudden lift in owner-occupied housing credit and the corresponding decline of investor credit, there is also likely to have been a re-classification of loans from investor to owner-occupied.
The share of loans going to housing was 60.89% as at January 2016, which is an all-time high. By contrast, the share of total loans to businesses was at 33.31% as at January, which is fractionally above June’s record low:
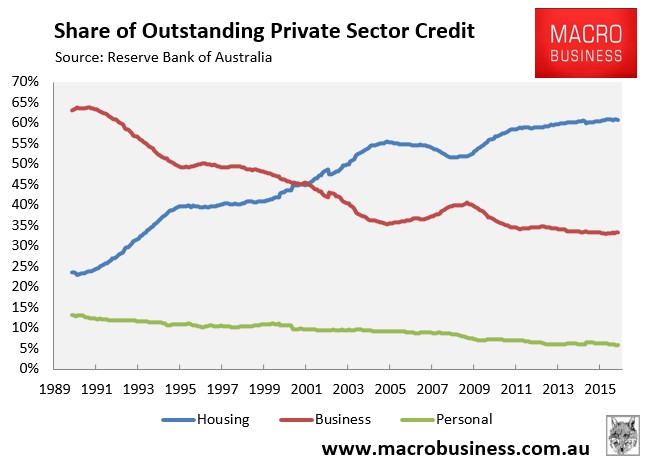
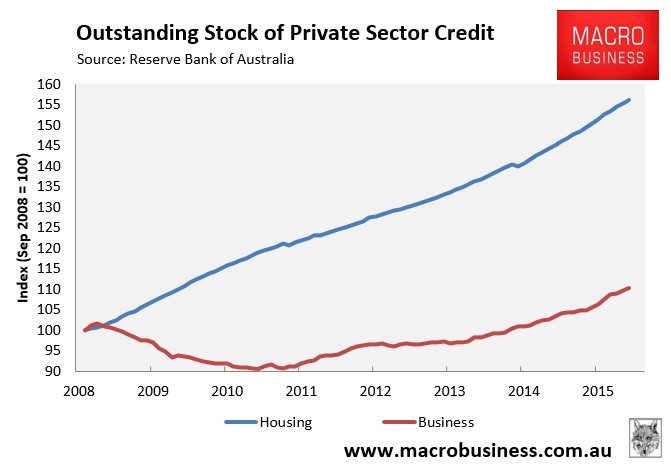
And since the GFC, outstanding loans to businesses have grown by only 10.4%, whereas loans to housing have surged 56.2%:
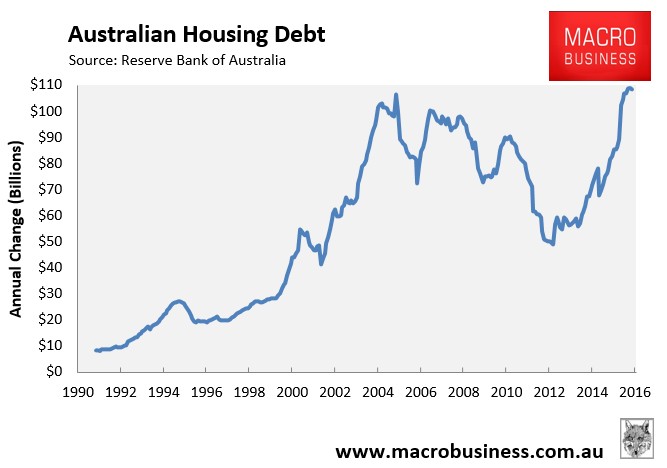
Finally, in nominal dollar terms, the annual change in outstanding Australian mortgage debt was $108.3 billion in the year to January 2016, still above the pre-GFC peak of $106.4 billion set in the year to January 2005:
unconventionaleconomist@hotmail.com
