
So far in 2016, most stock markets have lost in a few days what they normally gain over a year, highlighting the old adage that stocks go up a flight of stairs, but fall down an elevator shaft. Fear and Greed. Hasn’t changed even with HFT and algo’s.
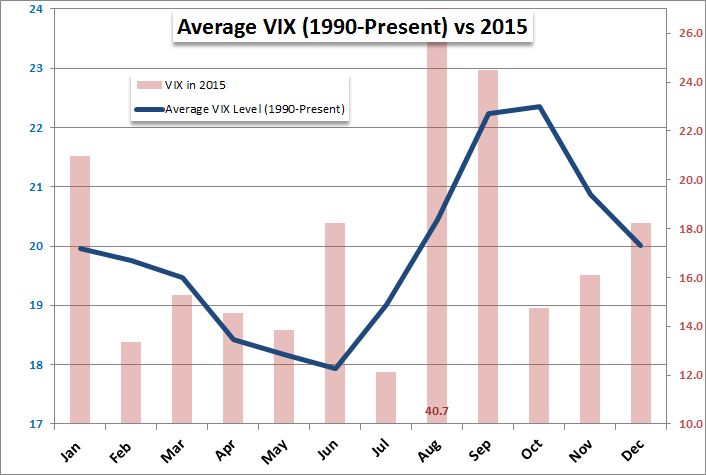
So far in January the VIX is well above last years print and the long run average:
While the weekly chart shows the bottoming – or Minsky moment if you will – for the VIX in mid 2014 now exploding to the upside and moving up to levels not seen since the last major risk market ructions in 2011: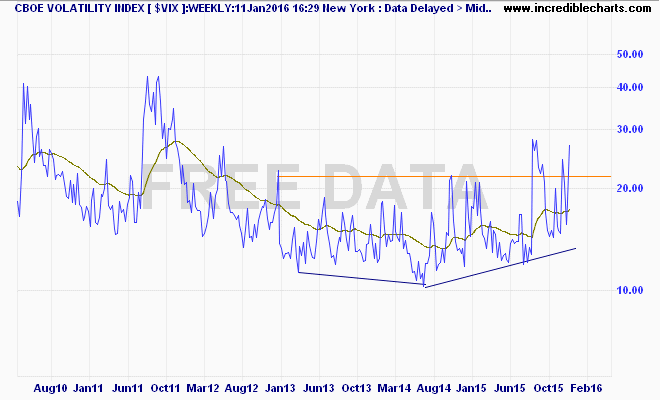
We may be going into a period of “Sell in May” and come back in…well 2017? 2018?