
Given Friday nights stonking non-farm payroll (NFP)/unemployment print from the US, comes this interesting chart from CLSA showing a correlation between the monthly print and the YoY change in the S&P500:
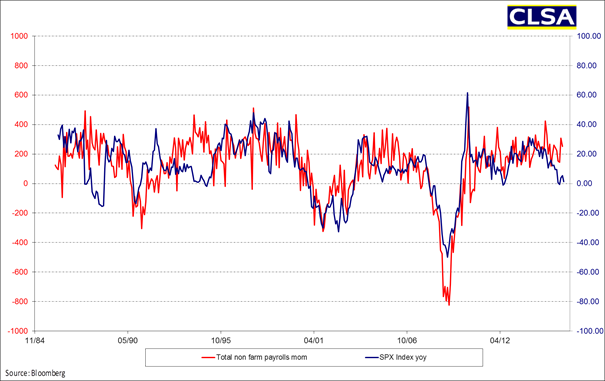
Anyone who has observed markets since the GFC knows how much emphasis is placed on the monthly jobs number, setting the gauge if not the direction of markets until the next print, particularly during the never ending bouts of QE by the Fed. This short termism or “buy the dip” has translated into longer term gains and moves on the S&P500 and other correlated markets, but this may only be a post-GFC phenomenon.
A quick glance to the left shows a more tenous correlation and this brings about one of the major dangers of constructing a model on how a market should behave based on past behaviour. This clustering effect or recency bias is something investors (and trading system developers) need to be wary of when observing charts like above.
But don’t discount a short covering rally amid this volatility – that is perfectly normal market behaviour as well. The macro overlay shows its more likely to be a bull trap…
NSFW but here’s how to “buy the f%^&ing dip”: