The Federal Reserve Bank of San Francisco (FRBSF) has released an interesting research note examining the current housing boom and how it differs from the pre-GFC event:
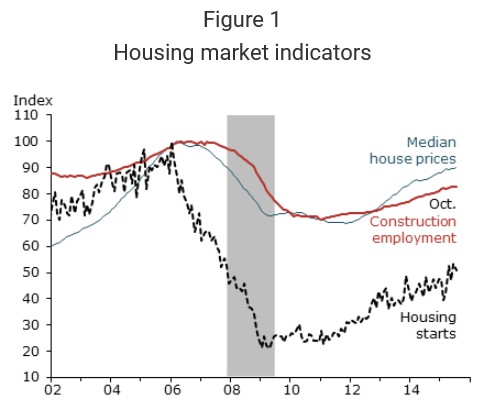
After peaking in March 2006, the median U.S. house price fell about 30%, finally hitting bottom in November 2011… Similarly optimistic homebuilders responded to the price signals and embarked on a record-setting building spree such that, at one point, the construction sector employed 5.7% of American workers, the highest percentage since 1959…
From peak to trough, the median house price and construction employment both dropped about 30%, while new housing starts plummeted nearly 80%…
Since bottoming out, the median house price has recovered to a level that is only 8% below its prior peak. Construction employment has recovered to around 17% below its prior peak. In contrast, the recovery in new housing starts has been more sluggish; the series remains roughly 50% below its prior peak—suggesting that homebuilders are exercising caution in light of the substantial overbuilding that occurred during the mid-2000s. The pattern in Figure 1 also suggests that there may be further upside growth potential for the housing market; continued high house prices should contribute to more building activity and more construction jobs.
The latest boom is different…
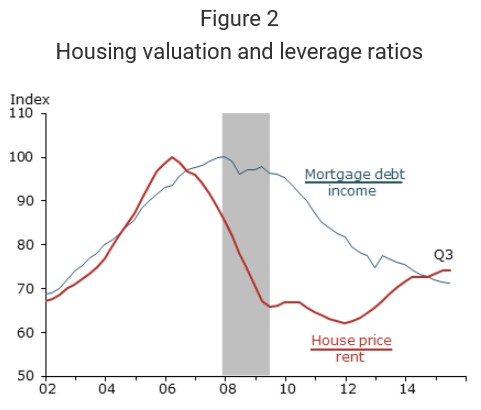
Figure 2 plots the house price-to-rent ratio and the mortgage debt-to-income ratio, each normalized to 100 at its pre-recession peak. The price-to-rent ratio (red line) reached an all-time high in early 2006, marking the apex of the housing bubble. Currently, the price-to-rent ratio is about 25% below the bubble peak. As house prices have recovered since 2011, so too has rent growth, providing some fundamental justification for the upward price movement.
The mortgage debt-to-income ratio (blue line) reached an all-time high in late 2007, coinciding with the peak of the business cycle…
Figure 2 shows that the house price-to-rent ratio and the mortgage debt-to-income ratio rose together in the mid-2000s, creating a self-reinforcing feedback loop. Since 2011, however, the two ratios have moved in opposite directions; the recent increase in housing valuation has not been associated with an increase in household leverage. Rather, leverage has continued to decline, reflecting a return of prudent lending practices, more vigilant regulatory oversight, and efforts by consumers to repair their balance sheets. The “red flags” are not evident in the current housing recovery. These observations help allay concerns about another credit-fueled bubble…
Bubble consequences are long-lasting…
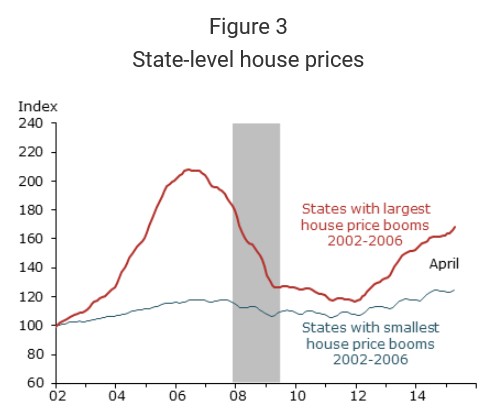
The states with the largest house price booms from 2002 to 2006 are Hawaii, Florida, Nevada, California, and Arizona. The states with smallest house price booms include a larger number of states mostly in the Midwest.
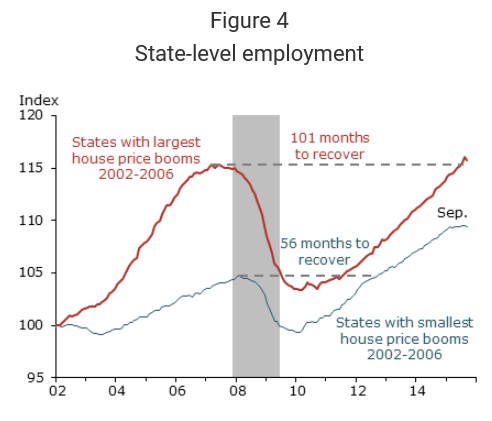
Figure 4 compares paths of the average payroll employment index in the same two groups of states, again normalized to 100 at the beginning of 2002. The states with the largest house price run-ups experienced much faster employment growth during the boom years and more severe employment drops during the bust years. In other words, the recession was more painful in states with large prior house price booms…
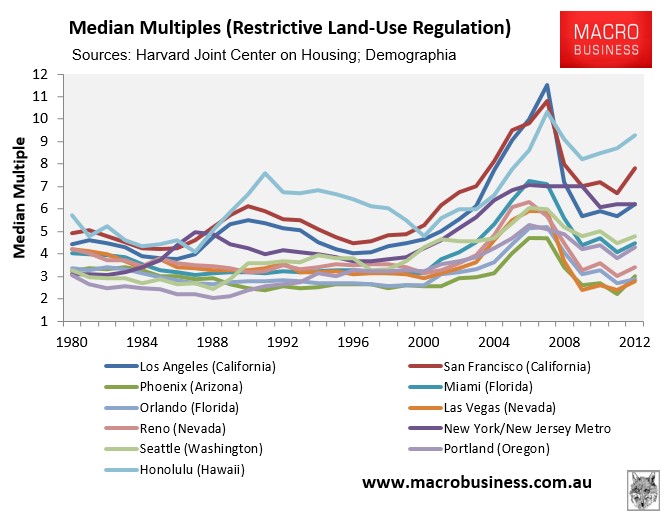
I will add that the American states which experienced the biggest booms/busts in house prices also tended to be the ones where land-use regulation and planning were the tightest. Hence, the boom in credit manifested more in land/house price appreciation than increased (affordable) construction:
Advertisement
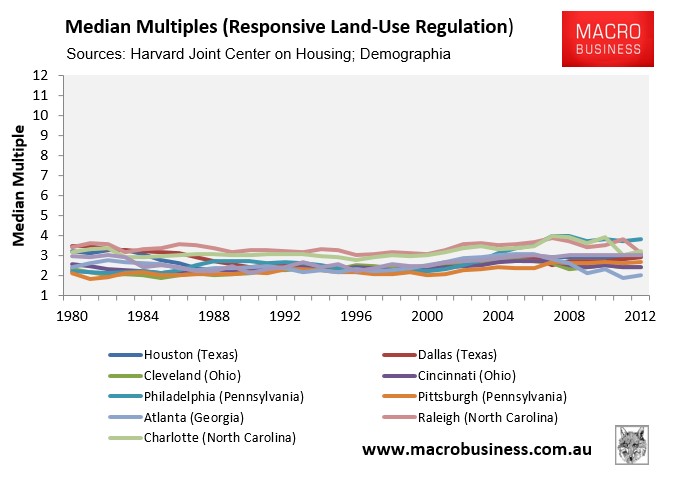
By contrast, those markets where land-use and planning tended to be more responsive to price signals experienced much smaller booms and busts in land/house prices:
Leith van Onselen is Chief Economist at the MB Fund and MB Super. He is also a co-founder of MacroBusiness.
Leith has previously worked at the Australian Treasury, Victorian Treasury and Goldman Sachs.