
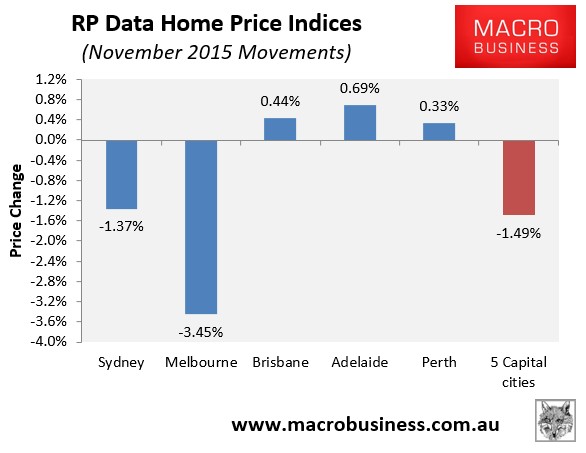
Core Logic-RP Data’s dwelling price results are in for November, with a 1.49% decline in values recorded over the month at the 5-city level, with heavy falls in Melbourne and Sydney more than offsetting smaller rises in the other major capitals (see next chart).
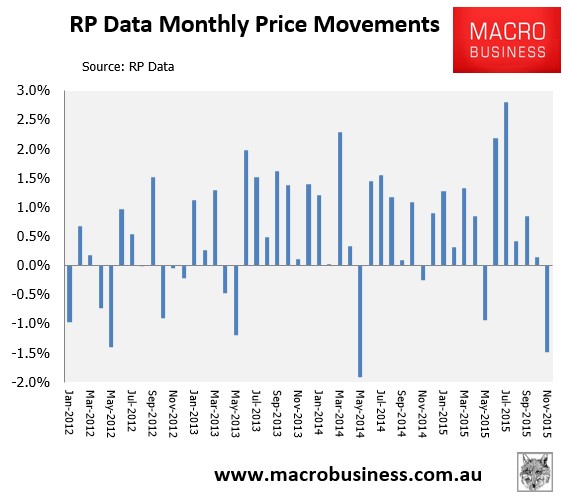
It was the first monthly fall in home values since the usual May seasonal decline (see next chart).
Over the quarter, values fell by 0.51% at the 5-city level, which was the lowest quarterly growth since December 2012 (see next chart).
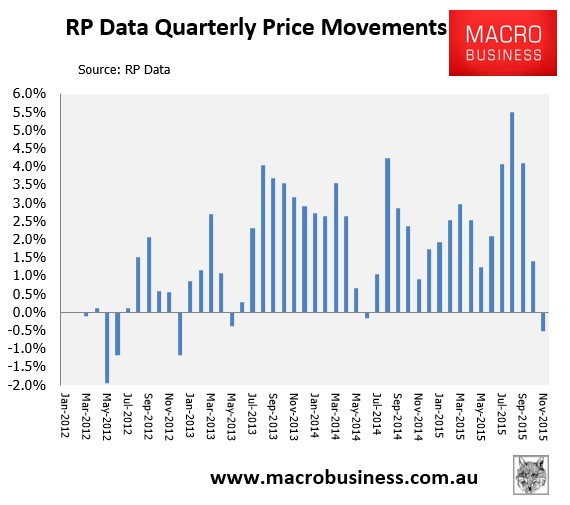
Over the quarter, values fell by 0.94% in Sydney, 0.56% in Melbourne, and by 1.92% in Perth. By contrast, values rose by 1.46% in Brisbane and by 0.85% in Adelaide.
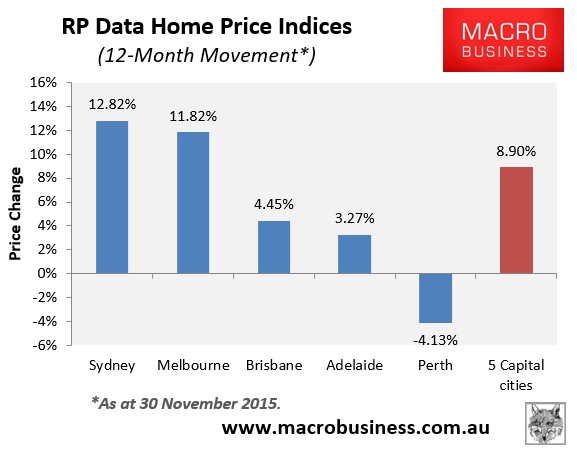
As shown in the below charts, annual price growth is fading at 8.90% at the 5-city level. Sydney (+12.82% YoY) and Melbourne (+11.82% YoY) continue to lead the way, followed by Brisbane (+4.45%) and Adelaide (+3.27%). By contrast, Perth values have fallen by 4.13% over the year:
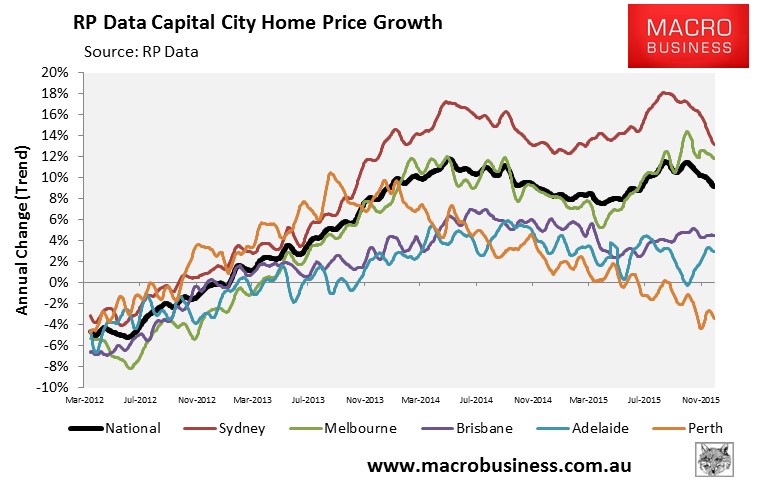
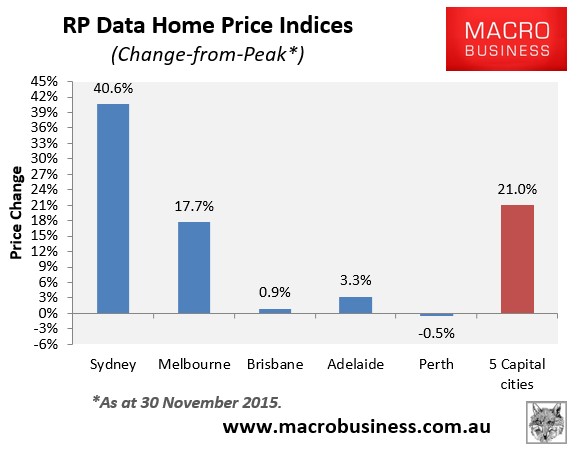
Values are now 21.0% above the October 2010 peak at the 5-city level, driven almost entirely by massive growth in Sydney (+40.6%) and to a lesser extent Melbourne (+17.7%), with the other major capitals basically treading water (down in real inflation-adjusted terms):
unconventionaleconomist@hotmail.com
