Goldman has a go at measuring how fast China is really growing today at FTAlphaville:
Given China’s rising importance to the world economy and financial markets, and uncertainty about the interpretation of recent data, the desire for an alternative, higher-frequency measure of growth is particularly acute at present. China’s third-quarter real GDP growth came in at 6.9% year-over-year (and 7.1% qoq annualized), slightly above consensus (and our) expectations. While reassuring on its face, several characteristics of the report raised questions among analysts:First, nominal GDP growth decelerated to its lowest pace on record–even below that in the GFC–at 6.2% yoy. The implied GDP deflator would be -0.6% yoy, much lower than +0.1% yoy in Q2;, though CPI inflation has accelerated in Q3 from Q2. Second, the composition of real GDP growth suggested accelerating activity in “other” services and still very robust (17% yoy) financial sector growth despite the stock market downturn. Third, key monthly economic data continued to disappoint, with the NBS manufacturing PMI touching a multi-year low in Q3 (the nonmanufacturing PMI came close to an all-time low), industrial production decelerating to 4.5% qoq annualized (by our seasonal adjustment), and fixed asset investment sliding as well.
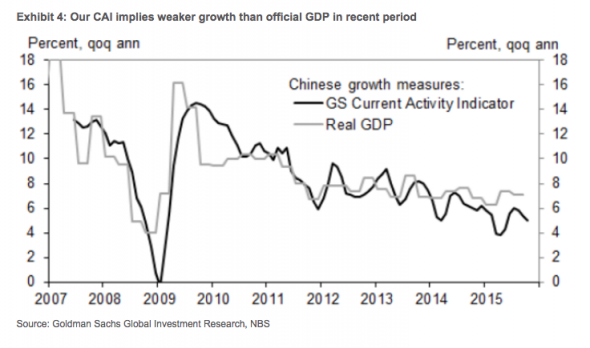
At least some of these seemingly contradictory data reflect a divergence in activity between different sectors of the Chinese economy. Though the pace of services growth can be debated, it is clearly outperforming manufacturing. Whether we look at the PMIs (Exhibit 1 below), other sector level indicators (See China: Tracking China’s consumption, Oct 12, 2015) , or company-level data (See Tracking the Chinese Consumer – Issue 6: After a weak 3Q, signs of pickup in auto, spirits and e-commerce, Nov 10, 2015) , we generally find faster growth in services. As an example, revenue growth of listed companies in “new China” sectors such as internet, life and health insurance was at 35% yoy as of 1H2015, while “old China” sectors such as metals and mining saw 0% revenue growth (See China Strategy: New China investing in a ‘new normal’ growth era, Nov 4, 2015). So, some of the confusion among investors and in media reports about the growth in the Chinese economy simply reflects a focus on different parts of the economy. Commodity exporters may view China as in recession, given a drop in commodity import volumes over the past year, whereas many online retailers or service providers see a healthier picture. We note that there is a much bigger gap between our proprietary measures of manufacturing activity (which we discuss below) and our proprietary measure of overall growth (the CAI), than between the CAI and the official real GDP data.
Taking the above observations on board, we are updating our China CAI to include additional indicators and better reflect what we believe to be the underlying amplitude of the business cycle. We have made several changes to the components of the CAI:
The full text of this article is available to MacroBusiness subscribers
David Llewellyn-Smith is Chief Strategist at the MB Fund and MB Super. David is the founding publisher and editor of MacroBusiness and was the founding publisher and global economy editor of The Diplomat, the Asia Pacific’s leading geo-politics and economics portal.
He is also a former gold trader and economic commentator at The Sydney Morning Herald, The Age, the ABC and Business Spectator. He is the co-author of The Great Crash of 2008 with Ross Garnaut and was the editor of the second Garnaut Climate Change Review.

Given China’s rising importance to the world economy and financial markets, and uncertainty about the interpretation of recent data, the desire for an alternative, higher-frequency measure of growth is particularly acute at present. China’s third-quarter real GDP growth came in at 6.9% year-over-year (and 7.1% qoq annualized), slightly above consensus (and our) expectations. While reassuring on its face, several characteristics of the report raised questions among analysts:First, nominal GDP growth decelerated to its lowest pace on record–even below that in the GFC–at 6.2% yoy. The implied GDP deflator would be -0.6% yoy, much lower than +0.1% yoy in Q2;, though CPI inflation has accelerated in Q3 from Q2. Second, the composition of real GDP growth suggested accelerating activity in “other” services and still very robust (17% yoy) financial sector growth despite the stock market downturn. Third, key monthly economic data continued to disappoint, with the NBS manufacturing PMI touching a multi-year low in Q3 (the nonmanufacturing PMI came close to an all-time low), industrial production decelerating to 4.5% qoq annualized (by our seasonal adjustment), and fixed asset investment sliding as well.