
Australian Finance Group (AFG) has released its housing finance data for the month of June, which registered a big rise in monthly mortgage applications, as well as a large increase year-on-year.
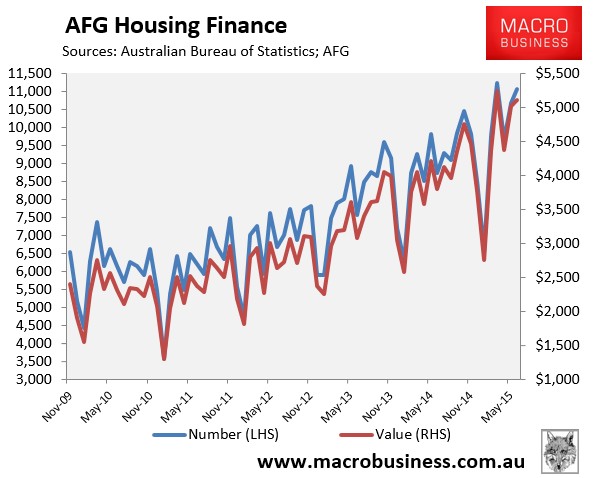
The number of mortgage applications rose by 3.6% in June and were up 26.4% over the year to 11,056, whereas the value of applications rose by 1.7% over the month and were up by 34.5% over the year to $5,103 million (see next chart).
According to AFG:
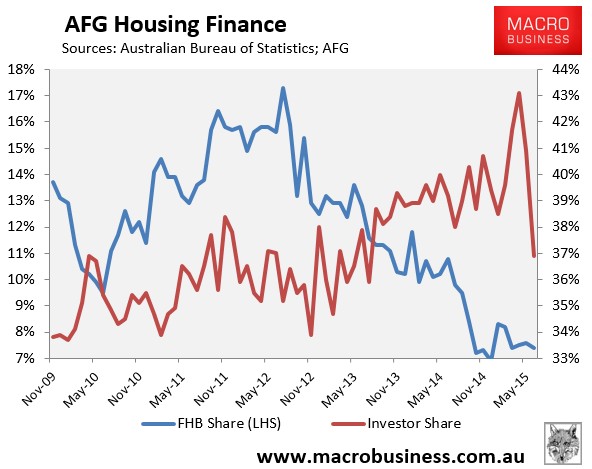
This is… AFG’s second highest month ever after achieving volume of $5.2 billion in March this year. While overall mortgage figures continue to be buoyant, the June figures showed a significant cooling for investment loans – down to 36.9% nationally from a peak of 43.1% in April. The last time overall investment loans were at similar levels was July 2013, when they comprised 35.9% of all mortgages processed.
Investment loans moderated most of all in NSW from 49.8% in May to 41.6% in June. Investment loans had been running at an average of 49.5% of all loans in NSW for the previous 12 months.
Elsewhere in Australia, the same moderating trend was repeated, with investment loans declining in SA from 41.8% to 36.8%, in QLD from 36.1% to 34.1%, in VIC from 36.5% to 35.7% and in WA from 31.8% to 31.2%.
Brett McKeon, AFG Managing Director says: “These figures suggest that APRA controls are starting to take effect, but not at the expense of the overall mortgage market. If this trend continues, it should help allay concerns about overheating in Sydney, in particular, as investment levels there come back into line with the sustainable, long term, national average”.
As noted above, investor mortgage demand dropped sharply to 36.9% in June, down from the record 43.10% recorded in April, whereas the share of mortgages going to first home buyers (FHB) was just 7.4% (see next chart).
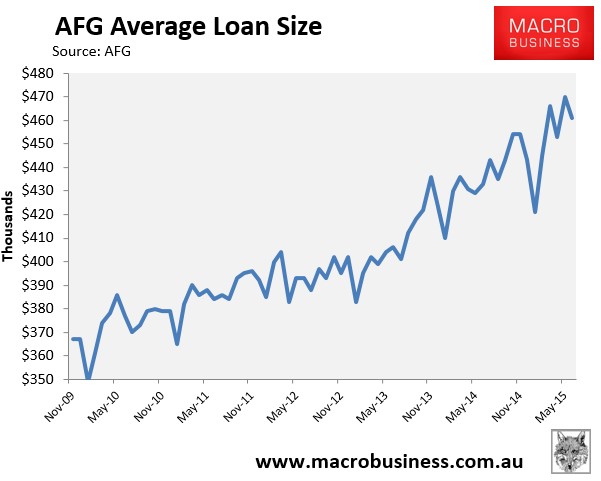
Meanwhile, the average mortgage size slipped back to $461,000 in June, although it was still up 6% over the year and by 14% since June 2013 (see next chart).
As noted previously, some caution should be exercised in interpreting AFG’s figures and extrapolating its results to the overall mortgage market, as measured by the Australian Bureau of Statistics (ABS).
AFG’s data measures mortgage applications, whereas the ABS measures actual mortgage commitments. According to AFG’s General Manager of Sales & Operations, Mark Hewitt, just over three quarters of applications on average become mortgage commitments, although this figure can obviously fluctuate month-to-month. AFG’s market share has also been rising in recent years.
Therefore, while AFG is a useful guide as to the strength of mortgage demand, its results do not necessarily translate to the overall mortgage market as captured later by the ABS.
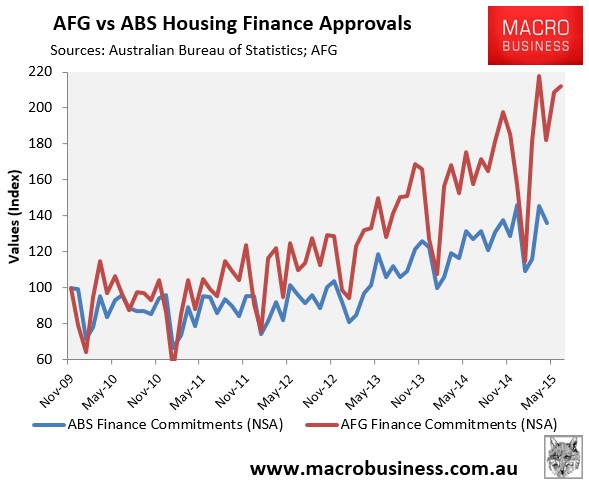
To illustrate, consider the below chart showing how the growth of AFG mortgage applications has diverged significantly from ABS mortgage commitments since November 2009:
It is good to see that APRA’s curbs on investor lending are having the desired effect. Let’s hope it continues.
