
In late April, the Australian Taxation Office (ATO) released its Taxation Statistics for the 2012-13 tax year, which once again revealed that Australia is a nation of loss-making landlords.
If there is one thing that differentiates the Australian housing market from most others, it is the propensity for Australians to leverage into buy-to-let investment properties in the face of negative income returns, in the expectation that capital appreciation will repay debt and interest.
‘Negative gearing’, as it is known in Australia, is a popular form of leveraged investment in which an investor borrows money to buy an asset, but the income generated by that asset does not cover the interest on the loan. By definition, a negative gearing strategy can only make a profit if the asset rises in value by enough to cover the shortfall between the income received and the costs incurred from the asset. Alternatively, a negatively geared property may become neutrally or positively geared in a period of high rental increases.
Australia’s negative gearing rules are unusual in that they allow investors, in both property and shares, to write-off the cost of borrowing used to acquire an asset in addition to other holding costs against all sources of income (including labour income), not just the income generated by the asset. There are also no limitations on the income of the taxpayer, on the size of losses, or the period over which losses can be deducted.
By contrast, in most other countries, rental property expenses cannot be deducted against unrelated labour income, which effectively limits negative gearing to professional investors and developers.
In effect, negative gearing provides Australians with a ‘tax shelter’ – a point acknowledged by the Hawke Government’s cabinet submission to re-instate negative gearing in 1987:
The negative gearing measure was introduced [in 1985] to partially close-off a generally recognised tax shelter, a rationale which remains broadly valid…
The three basic features of a typical tax shelter are the absence of a full nominal capital gains tax, the deductibility of full nominal interest expenses, and a mis-match in the timing of the deductions and the recognition of taxable income (for example, because capital tax is payable on a realisations rather than accrual basis).
Rental property investment clearly exhibits each of these features, as do some other activities, and so effectively obtains tax benefits under the current tax system.
When combined with the Howard Government’s decision in 1999 to change the nation’s capital gains tax (CGT) rules, by halving the rate of tax payable on capital gains earned on assets held for more than 12 months, Australia’s strong house price appreciation since the late-1990s has allowed investors to make strong after-tax returns.
There is a dark side, however, with investors increasingly crowding-out first home buyers from the property market, consigning an increasing proportion of younger Australians to a life time of rent, or paying-off jumbo-sized mortgages.
Australia’s insatiable appetite for investment property continues:
Australia has experienced a surge of negatively geared property investment (and property investment more generally) from the late-1990s . There are two main reasons for this.
First, financial deregulation led to a surge of new loan products in the mid-1990s, including those targeted at investors. These included interest only loans, as well as the new found ability to purchase an investment property through accessing equity in one’s existing home, without having to put in any cash up front, effectively allowing 100% debt financing of an investment property.
Second, the Federal Government’s decision, in 1999, to halve the rate of CGT payable on capital gains earned on assets held for more than 12 months encouraged investors to speculate on rising housing values with the full knowledge that any losses would reduce their overall tax liability, and any capital gains would be taxed at only half the rate of labour income.
Indeed, the ability of investors to minimise tax via negative gearing, combined with easier access to credit and the halving of CGT in 1999, has seen Australia become a nation of landlords (see next chart).
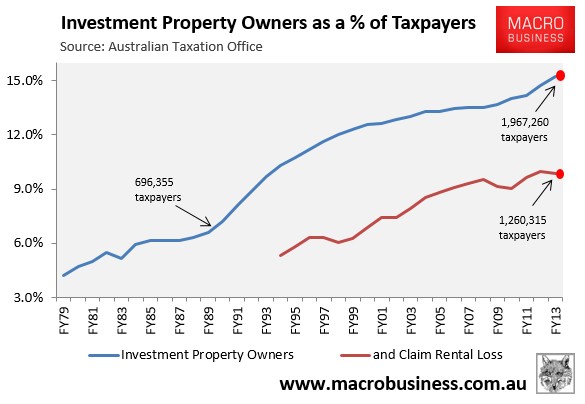
In 1989-90, 696,355 taxpayers – 7.4% of the total – reported net rental income to the Australian Taxation Office (ATO). But in 2012-13, 1,967,260 did – 15.2% of total taxpayers.
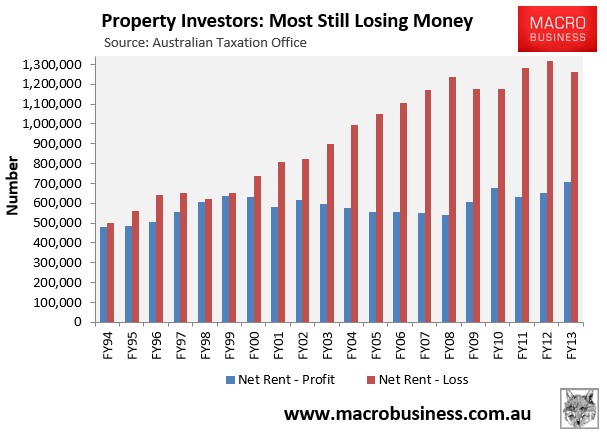
Moreover, in 1998-99, the number of investors claiming net rental profits (i.e. ‘positively geared’) was roughly equal to those claiming net rental losses (i.e. ‘negatively geared’). However, after the rate of CGT was halved, the situation changed markedly, with the latest ATO data showing that there were just over 1.26 million negatively geared property investors in Australia in 2012-13, representing 64% of all property investment (see next chart).
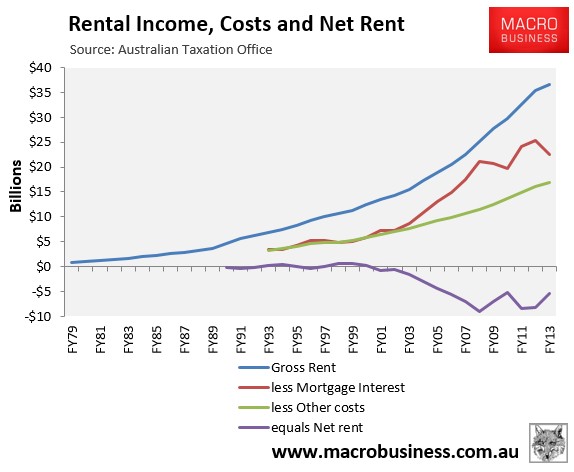
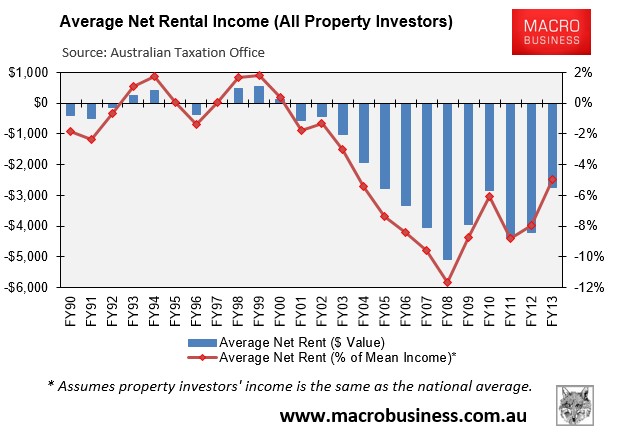
Similarly, up until 2000 property investment was more or less neutral from an income perspective, with aggregate rental receipts covering costs. From 2000 onwards, however, net rents deteriorated sharply; with aggregate losses totaling $5.4 billion in 2012-13 (see next chart).
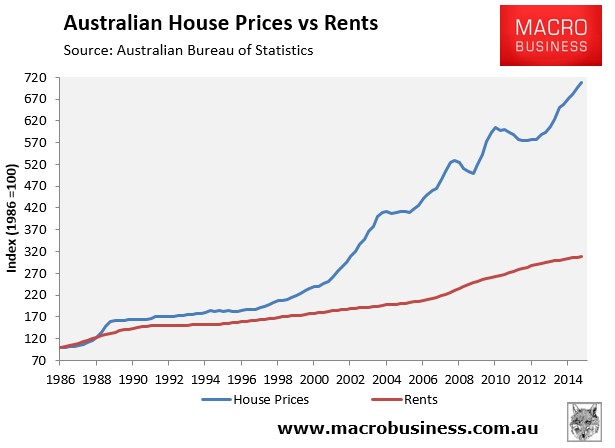
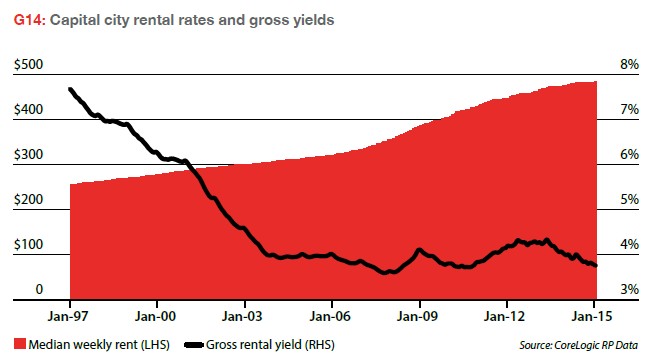
The worsening rental returns since 2000 are primarily accounted for by the strong appreciation of house prices relative to weaker rental growth (see next chart).
That said, despite the ongoing (200,000) increase in property investors, aggregate rental losses in 2012-13 were lower than the 2007-08 peak when property investors claimed a record $9.1 billion of losses. They were also below the $8.3 billion of losses claimed in the prior financial year (2011-12).
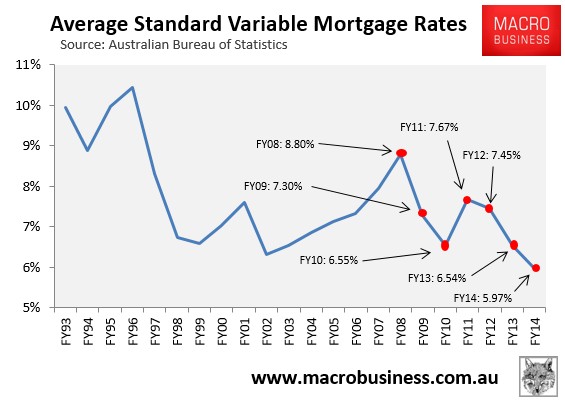
The fall in rental losses over this period was due primarily to the sharp reduction in mortgage rates – from an average of 8.8% in 2007-08 to 6.5% in 2012-13 – which reduced the amount of mortgage interest payable.
As shown in the next chart, average mortgage rates decreased further, to just under 6.0% over 2013-14, which other things equal would reduce net rental losses when the ATO Taxation Statistics (covering FY14) are released next year.
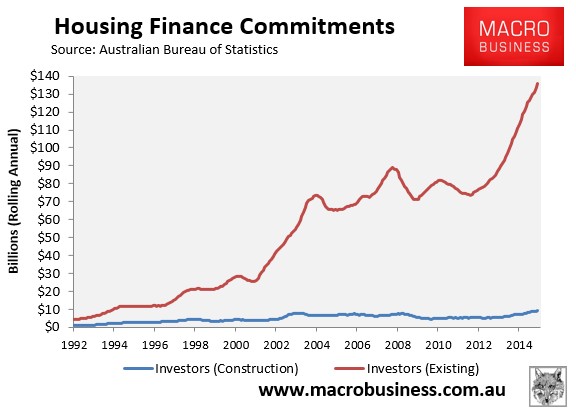
Offsetting this, however, is the explosion of property investment since 2012-13, as shown in the next chart:
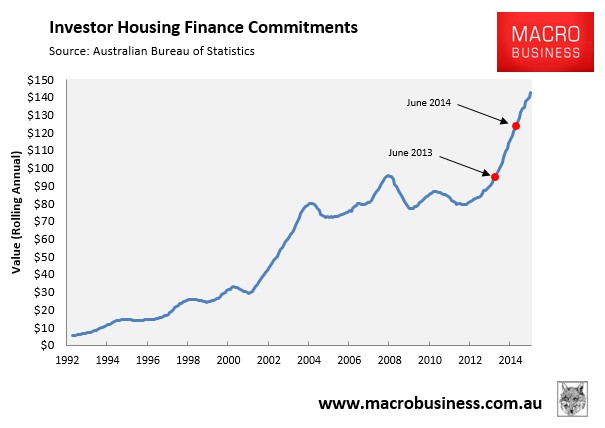
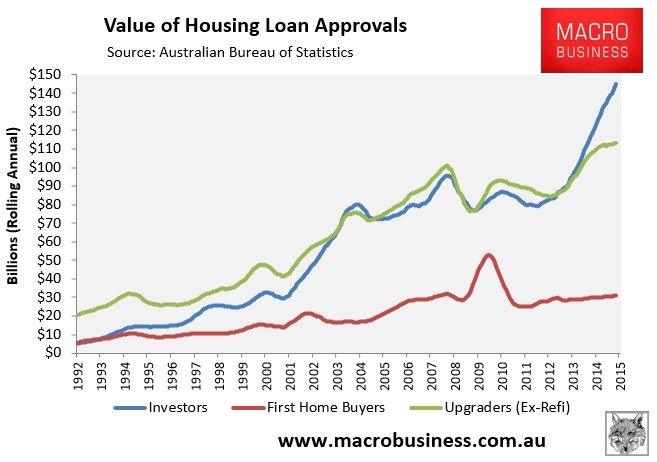
In the year to June 2013, there was $95.1 billion worth of investor finance commitments. However, in the year to June 2014, investor finance commitments had grown to $123.1 billion – a 29% increase. The trend has continued so far this financial year, with the value of investor finance commitments hitting a record high $145 billion in the year to April 2015.
Given the huge rise in property investors entering the market, along with the steady erosion of rental yields as prices have escalated (see next chart), it is highly likely that aggregate rental losses will increase over the next two tax years irrespective of the fall in mortgage rates.
Rental losses still comprise a significant proportion of income:
To put the total income losses into perspective, rental losses across all investment properties nationally averaged $2,742 per investor in 2012-13, or 5.0% of average taxable income (see next chart).
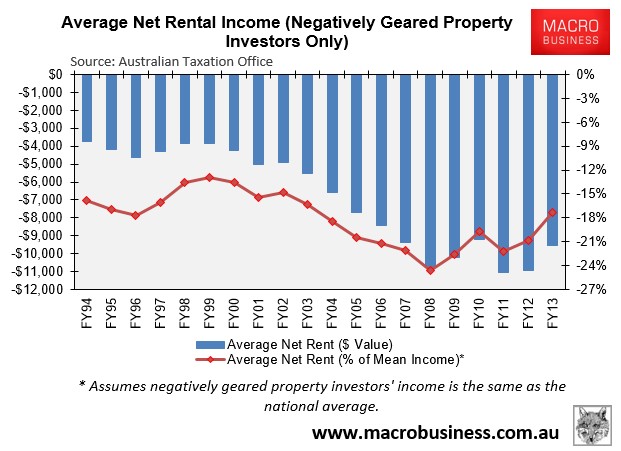
However, losses for negatively geared investors were much higher, totaling $9,558 per investor in 2012-13, or 17% of average taxable income (see next chart).
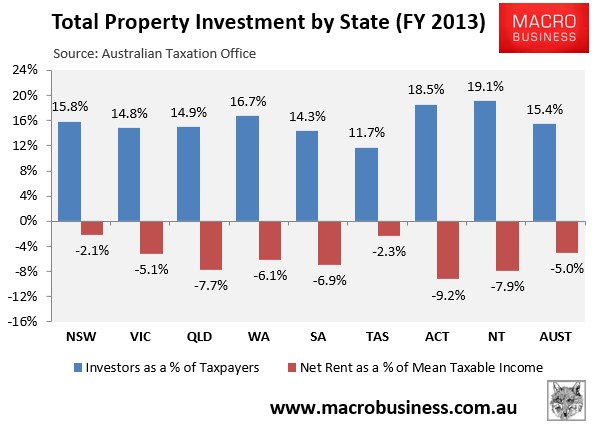
At the state and territory level, property investment is most pervasive in the Northern Territory and the ACT, with those two jurisdictions also incurring the highest income losses (see next chart).
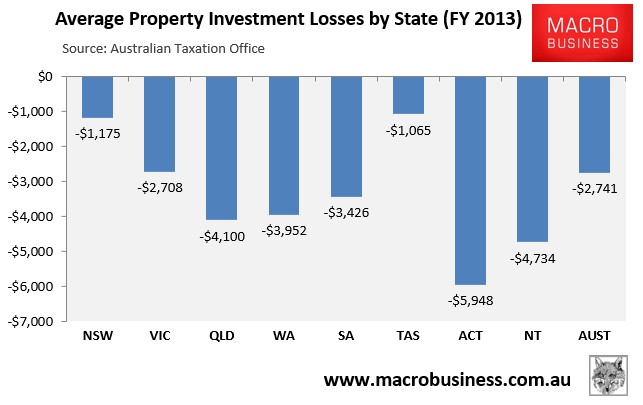
Similarly, actual average dollar losses per property investor in 2012-13 were highest in the ACT ($5,948) and the Northern Territory ($4,734), and lowest in Tasmania ($1,065) and New South Wales ($1,175):
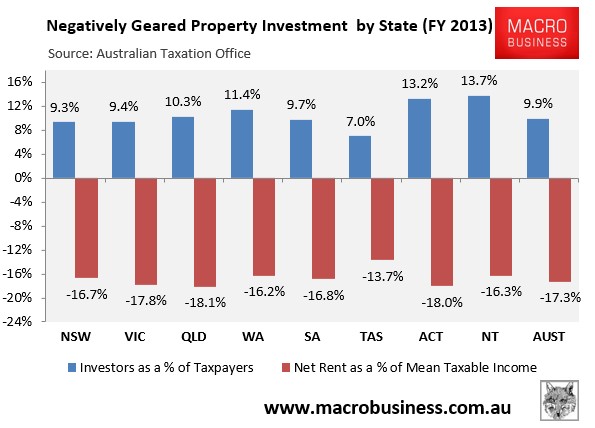
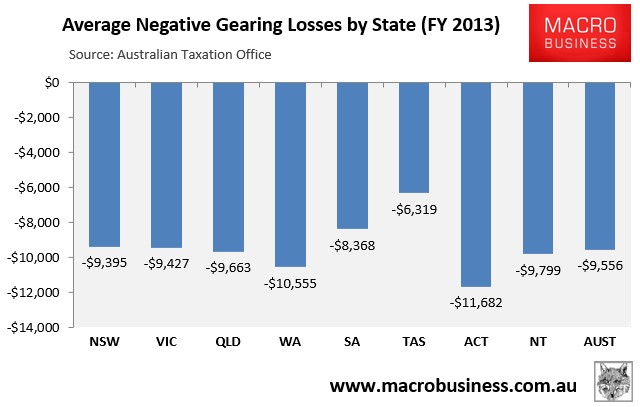
Looking at negatively geared property investment only, investment is again most pervasive in the Northern Territory and the ACT, whereas actual income losses are highest in Queensland and the ACT:
Finally, actual average dollar losses per negatively geared property investor in 2012-13 were highest in the ACT ($11,682) and Western Australia ($10,555), and lowest in Tasmania ($6,319) and South Australia ($8,368):
Losses are concentrated amongst higher income earners:
A common defence used to support negative gearing is that it is utilised primarily by lower and middle income earners. This view is not supported by the latest ATO statistics when losses are compared against taxable income.
Taxable income is what is left after legitimate deductions such as negative gearing are accounted for. For example, if someone earning $89,000 a year in 2012-13 claimed the average negative gearing loss of $9,558 that year, then their taxable income would be reduced to $79,442, thus making them appear to be a lower income earner than they actually were.
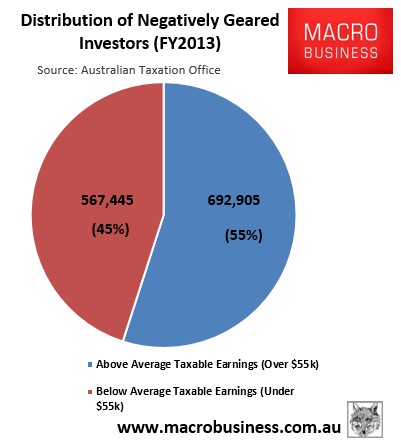
Nevertheless, the average taxable income in 2012-13 was only $55,228. So if it was true that lower and middle income earners were the primary users of negative gearing, then we would expect to see the majority of users earn less than average.
However, the ATO statistics clearly show that 55% of negatively geared investors in 2012-13 earned above the average, thus debunking this myth (see next chart).
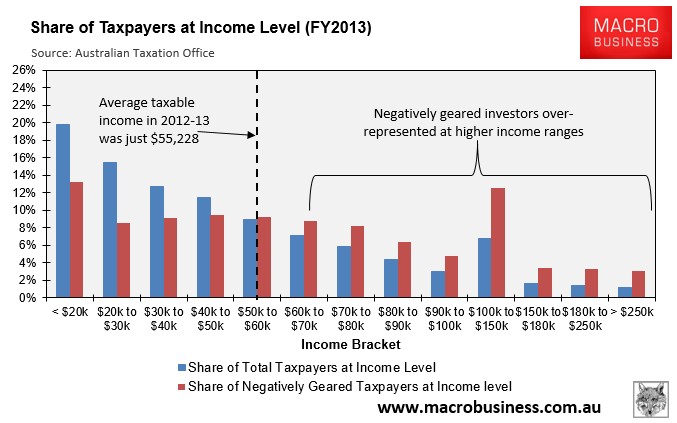
The ATO statistics for 2012-13 also shows that the number of negatively geared taxpayers was significantly under-represented at the lower taxable income levels and over-represented at the higher taxable income levels (see next chart).
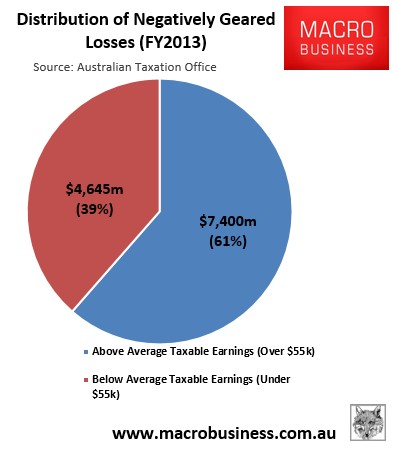
The picture gets even worse when the dollar value of losses, rather than the number of users, is examined. As shown in the next chart, those with taxable earnings below the average of $55,228 claimed only $4,645 million, or 39% of the total negative gearing losses in 2012-13, with those earning above average claiming $7,400 million, or 61% of total negative gearing losses:
Moreover, the breakdown by income range shows that higher taxable income earners claimed an even higher share of the negative gearing losses in 2012-13 (see next chart).
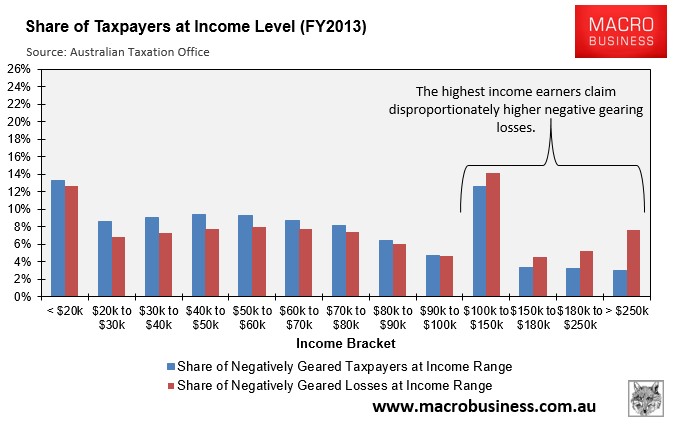
Therefore, based on the ATO statistics, which understate the magnitude of the issue because negative gearing lowers taxable income, the claim that most people who access negative gearing are lower and middle-income Australians is false. 55% reported earnings above the average taxable income in 2012-13, with their share of losses at 61%, even after their reportable incomes were reduced by more than the average.
The use of negative gearing also increases with income, and the value of losses claimed even more so. At every income level above $100,000, the income written off using negative gearing, in relation to total income written off using negative gearing, was higher than the proportion of individuals using negative gearing in relation to total negatively geared individuals.
Are negative gearing’s days numbered?
While the Abbott Government has ruled-out making changes to negative gearing, there is growing pressure for reform, given the deleterious impacts on housing affordability negative gearing has and its ongoing drain on the Federal Budget.
The Australian Greens earlier this month released their policy to quarantine negative gearing so that rental losses on both houses and shares could no longer be claimed against unrelated wage/salary earnings.
Under the Greens plan, those already holding negatively geared investments would be grandfathered, with the changes only affecting new investors from a specific date.
The Parliamentary Budget Office (PBO) has costed the Greens’ negative gearing policy and estimated that it would increase Budget revenue by $2.94 billion over the 2014-15 forward estimates, assuming the policy was implemented for all asset classes purchased on or after 1 July 2015. Moreover, the PBO estimated the proposal would increase revenue by $42.5 billion over the period to 2024-25.
The Australian Labor Party has also indicated that it is considering removing negative gearing on existing dwellings, but leaving it in place for newly constructed dwellings and those already in the market.
If either the Greens’ or Labor’s approaches were adopted, we could expect a significant dampening effect on the housing market.
Negative gearing only makes sense when house prices are rising. However, with fewer new investors entering the fold, price growth will stall, leaving existing negatively geared investors with loss-making properties. In turn, some investors would likely sell-up, putting further downward pressure on house prices.
The Government and the property lobby have countered against changes to negative gearing, arguing that if it was wound-back, then there would be less investment into rental homes, reducing supply and raising rents.
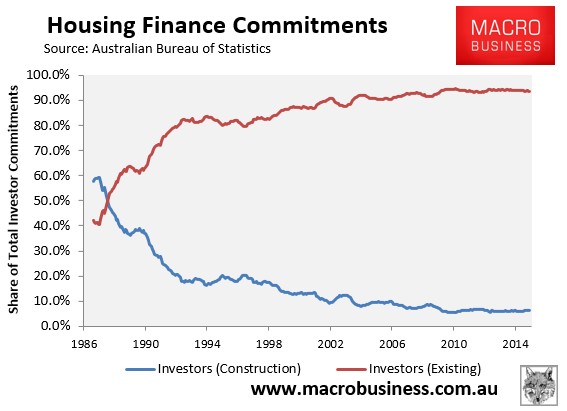
This argument has never passed scrutiny, since over 90% of investors purchase existing dwellings, therefore, they are not increasing housing supply, and are merely substituting homes for sale into homes for let (see below charts).
In reality, if negative gearing was abolished, and some investors sold their investment properties, they would be purchased by renters (or other investors). In turn, these renters would become owner-occupiers, thereby reducing the demand for rental properties, and leaving the rental supply-demand balance (and rents) unchanged.
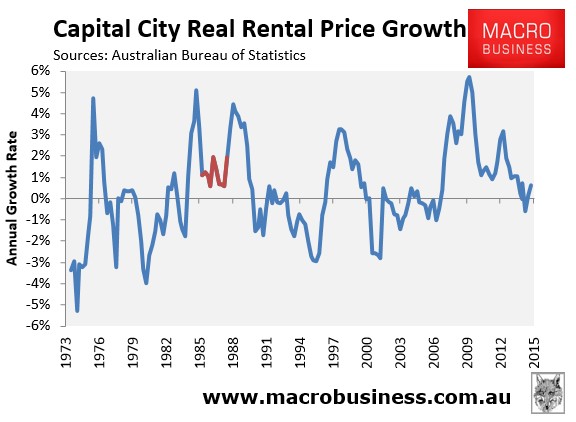
Indeed, this is exactly what happened when negative gearing was temporarily quarantined between 1985 and 1987. Back then, there was no discernible impact on rents, with rental growth nationally higher both before and after negative gearing’s removal (shown in red):
Negative Gearing raises the risk of a boom and bust in house prices:
The current make-up of Australian mortgage demand is not conducive to sustainable house price growth.
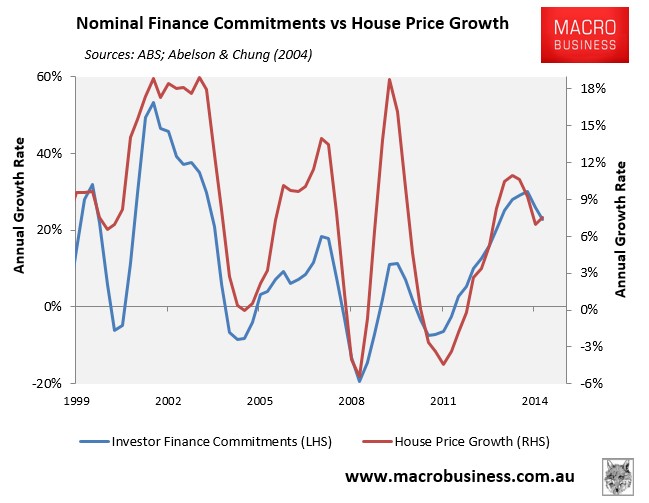
The current boom in dwelling prices is being driven by insatiable investor demand, which hit a record 50.0% of total finance commitments (excluding refinancings) in the year to April 2015 (see next chart).
Indeed, as shown in the next chart, there has been a very strong correlation between investor finance commitments and house price growth, particularly during the early-2000s boom and the current episode:
The concern is that investors – where the decision to purchase property is based on weighing-up and considering alternative investment returns – are more likely to be fickle and cut-and-run as soon as conditions change, or more profitable opportunities are presented elsewhere. This places Australian housing on a more fragile footing than if demand was driven primarily by owner-occupiers, who tend to buy into housing for the longer-term.
Expecting ongoing strong capital growth in the face of declining yield also suggests a very strong belief in the “greater fool theory”, and is ultimately unsustainable.
Adding to these risks is the fact that Australian housing valuations are already at their highest level on record and are continuing to grow. At the same time, the economy is about to embark on its biggest adjustment since the early-1990s recession, with large falls in capital expenditures expected as the once-in-a-century mining investment boom unwinds, along with the upcoming closure of the Australian automotive assembly industry in 2017, both of which will cause large job losses.
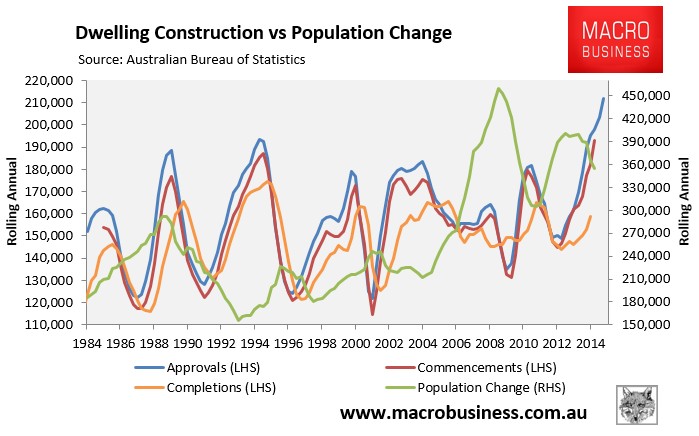
Overlaying these headwinds is the dwelling construction boom, which is taking place as population growth slows (see next chart), and will eventually place downward pressure on both prices and rents, as well as employment once construction levels subside.
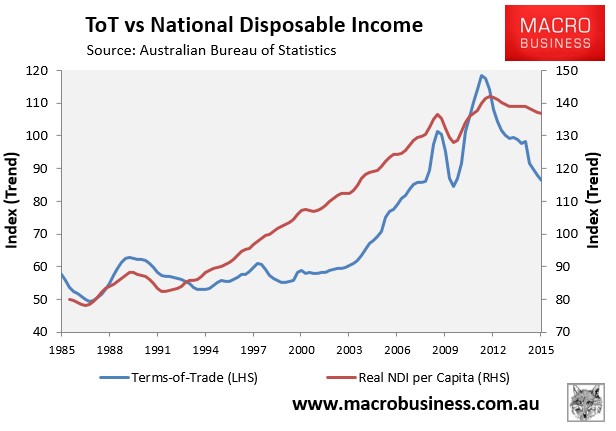
Meanwhile, income growth is likely to remain anaemic for the foreseeable future as the unwinding of the biggest commodity price boom in the nation’s history continues to drag on the terms-of-trade and national incomes (see next chart).
These factors combined will likely keep unemployment elevated and ultimately reduce the scope for house price and rental growth, in turn diminishing the potential returns from housing speculation. That is before even considering any potential for a global shock that could impact on the borrowing costs of Australian banks, or any diminution of confidence by international ratings agencies in the sustainability of Australia’s budget deficit, which could also affect banks’ borrowing costs.
Once investors realise that Australian housing is ex-growth, there will be little incentive to invest in what is a loss-making endeavour, prompting a negative flow of investors into the market, pulling down prices in the process.
What was a positive feedback loop that caused dwelling prices to rise could just as easily cause prices to fall, even without policy changes to curb negative gearing’s use. Such is the nature of pro-cyclical finance.
Given the known headwinds ahead for the Australian economy, it is out best guess that the Australian housing market will enter a correction phase by 2017. We recommend taking profits.
