
by Chris Becker
By now, a general consensus has been laid down that the mainland Chinese stock exchanges are in a clear bubble like condition. Central bank opposition to being able to identify bubbles aside, the record high valuations – using any sort of price/earnings or revenue measures – plus the more reliable % gains over time all point to a speculative excess.
So the commentary thus turns to: when will it pop? Its going to pop, but when? How long before it pops? And almost all are surprised when it doesn’t, shaking their heads in disbelief as its moves higher and higher.
We should not be surprised by how high bubbles can go once identified. A classic case is the NASDAQ during the 1990’s tech boom. Once it began trading at a stratospheric P/E ratio of 100 times, it then doubled over the next 18 months!
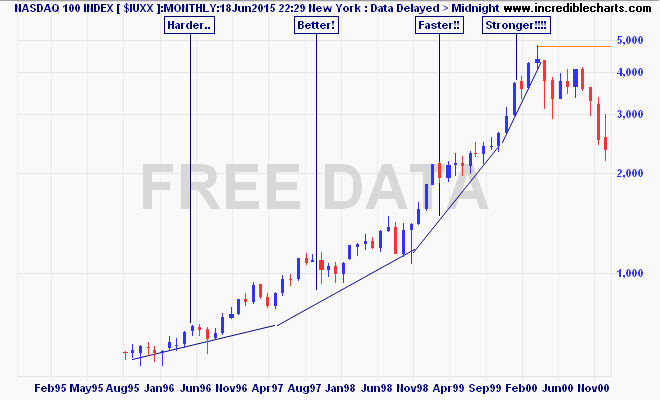
That’s a semi-log chart by the way, showing the move from 1000 to 2000 points as the same magnitude of 2000-4000 points and should be the only way to look at long term series of stock prices, in my opinion.
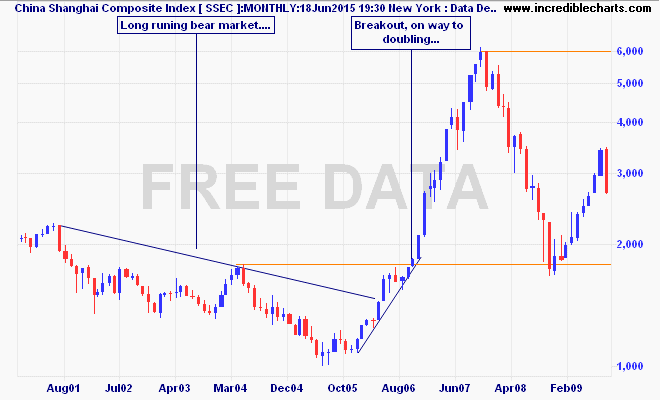
The Shanghai Composite itself is accustomed to bubble mania. After a severe bear market in the first half of the previous decade, reaching a low of 998 points in June 2005, it swiftly doubled to over 2000 points in just over a year…and then doubled again only six months later!
The current move is almost at the previous high at 6000 points, so is on par with the previous nominal gains:
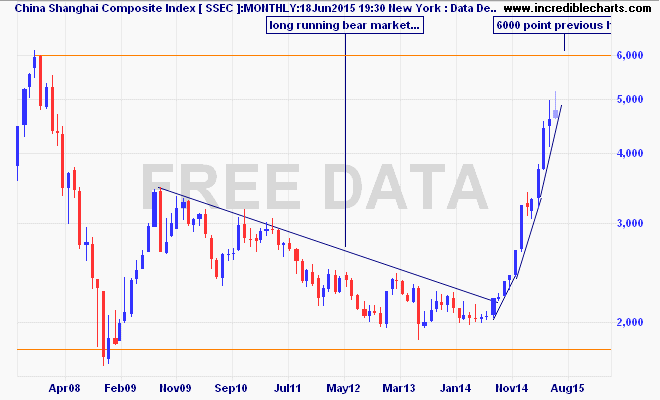
But if history repeats in terms of percentage magnitude, where the previous gains were a quadrupling from the breakout low to the top, then the Shanghai Composite could reach all the way up to 8000 points before finally bursting!
Never bet against the stupidity of the crowds using logic and rational analysis. Trade the price and manage the risk first.