
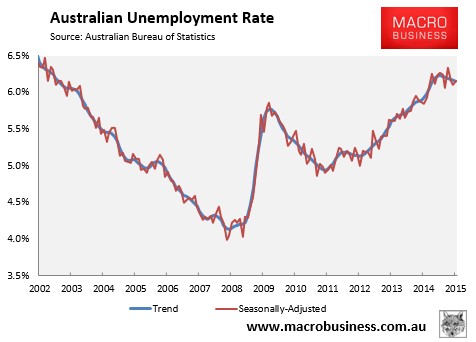
As summarised earlier, the Australian Bureau of Statistics (ABS) today released labour force data for the month of April, which registered a small rise in the headline unemployment rate (from 6.1% to 6.2%).
The result disappointed analyst’s expectations, who had expected the unemployment rate to rise to 6.1% but with 4,000 new jobs created.
In trend terms, the unemployment rate improved to 6.1% in April from March’s 6.2%:
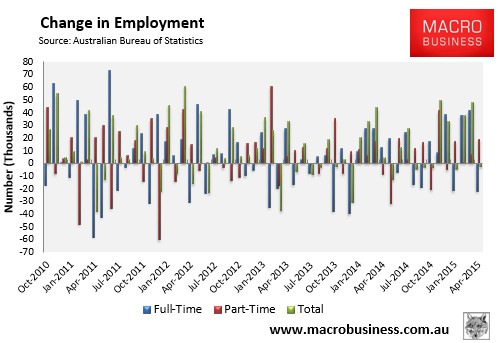
Total employment decreased a seasonally adjusted 2,900 to 11,724,600, with full-time employment decreasing by 21,900 to 8,115,900, partly offset by part-time employment, which increased by 19,000 to 3,608,600.
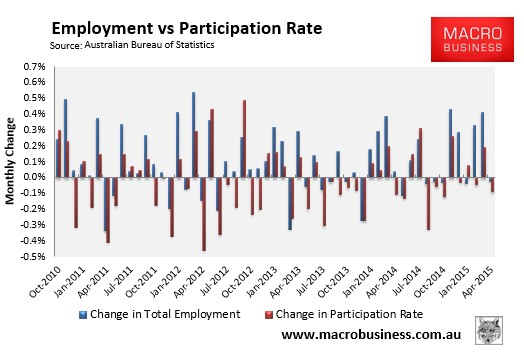
Meanwhile, the Participation rate decreased by 0.1% to 64.8%.
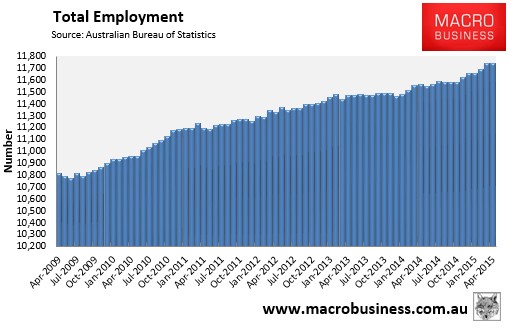
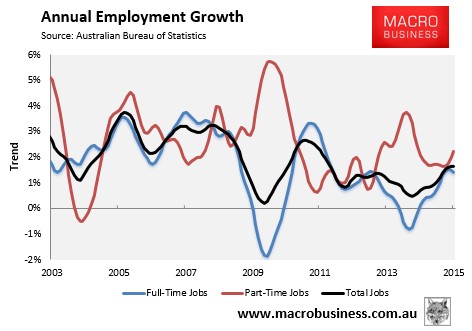
The trend in total employment has improved in recent months (see next chart).
But full-time jobs growth (1.3% seasonally adjusted, 1.4% trend) is weakening once more (see next chart).
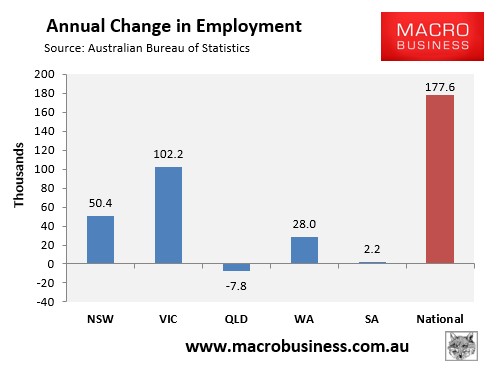
Surprisingly, Victoria has driven jobs growth over the past year in seasonally adjusted terms. By contrast, Queensland has shed jobs (see next chart).
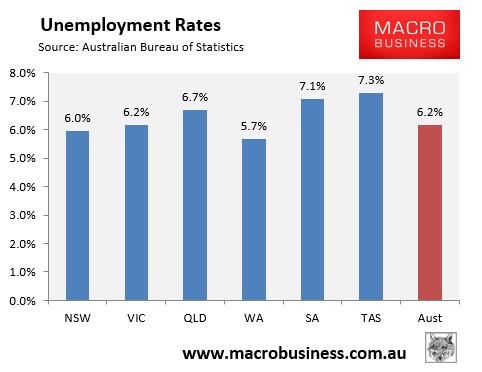
And Queensland and South Australia now have the highest seasonally adjusted unemployment on the mainland, whereas Western Australia and New South Wales have the lowest (see next chart).
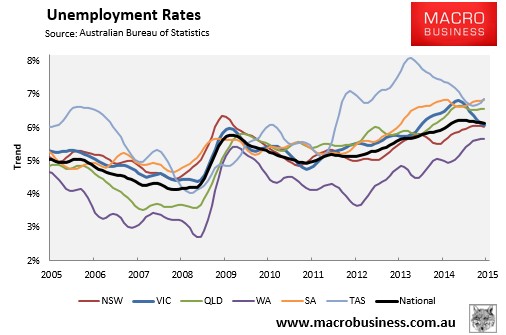
The state seasonally-adjusted figures are notoriously volatile and subject to a big margin of error. As such, the below chart shows the ABS’ trend unemployment rates, which shows Western Australia with the lowest unemployment (but rising slowly), South Australia, Tasmania and Queensland with the highest, and Victoria’s and New South Wale’s improving:
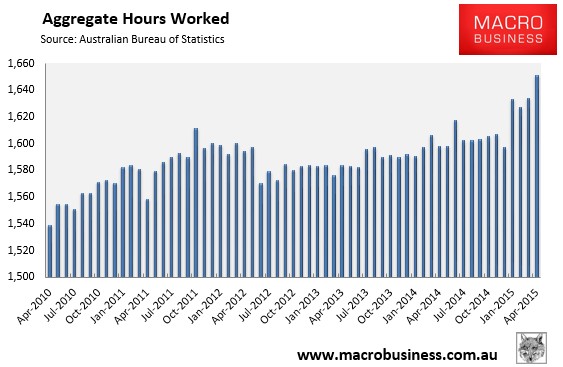
Aggregate number of hours worked jumped in seasonally adjusted terms in April (up 17.8 million hours or 1.1%). It has also risen by 3.3% over the past year, which is well above the growth in the population:
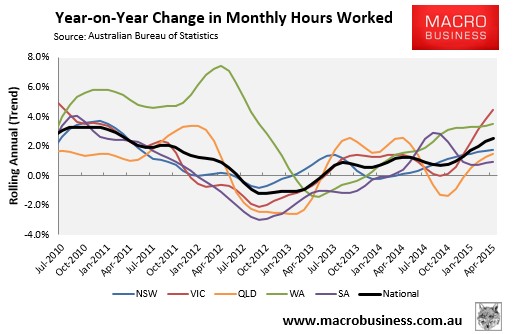
The below chart, which tracks the changes in hours worked on a trend basis, shows a mixed bag across the states but a strongly rising trend nationally (+2.6% YoY):
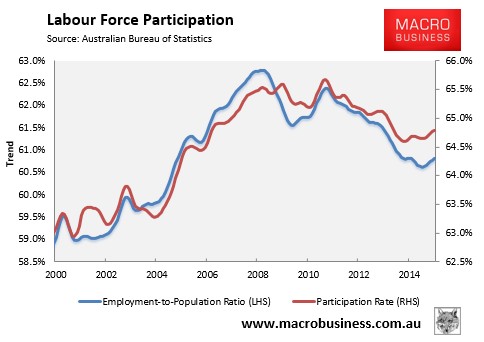
The participation rate is also recovering, as is the employment-to-population ratio:
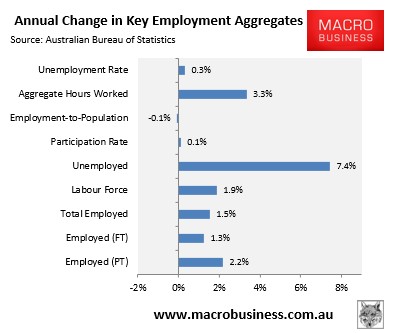
Finally, to round things out, the next chart summarises the annual change in the key employment aggregates on a seasonally-adjusted basis:
Overall, this is a better report than the headline suggests, with the aggregate number of hours worked growing strongly and labour force participation improving.
Nevertheless, I view the recent improvement in labour market conditions as nothing more than short-term respite to a deteriorating medium-term situation.
Undoubtedly, the labour market is being supported by record high dwelling construction and other housing-related industries, brought about by cheap credit and continued strong house price appreciation. However, the housing market is unsustainable and is likely to top-out sometime later this year or early next, just as the unwind of mining investment accelerates and the local car industry shutters.
2015 was never the problem for Australia’s labour market. It is 2016 and 2017 that are the concern, as the economy faces the triple threat of falling mining-related employment; falling housing-related employment; and falling manufacturing (car industry) employment.
