
By Chris Becker
First a recap of Friday’s action and then a longer term technical view of the major risk markets as we head into the “Sell in May” season. A quiet-ish afternoon across Asia translated into a tepid European session and then an upbeat US session with most markets closing 1% or more in the green as oil prices came off the boil and the USD strengthened.
The key economic news on Friday night was the US ISM Manufacturing PMI for April which came in bang on target at an expansive 51.5 points which helped lift sentiment.
Looking at bond markets first, while European bonds took a breather after a sudden sell off earlier in the week, US Treasuries have had a substantial selloff with the 10 years rising 8 points to 2.11%:
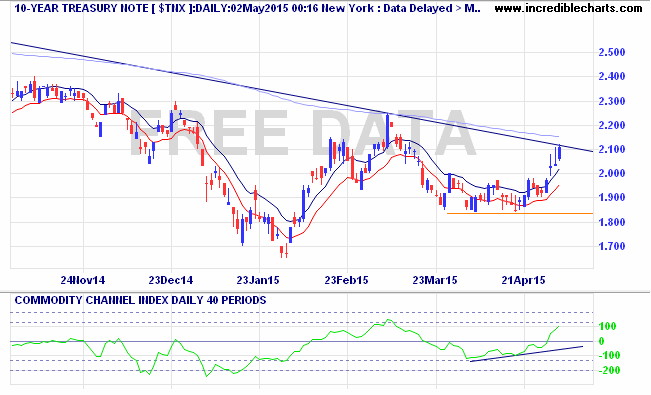
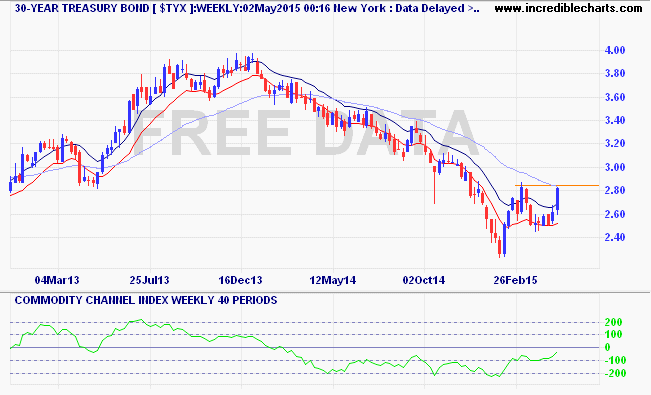
The daily chart above shows the downtrend line which corresponds roughly with the 200 day moving average and surprising momentum after a breakout above the key 2% level. The next line of resistance is 2.3% and we may get there sooner rather than later as the longer term 30 year weekly chart shows another attempt to break free and hit 3% yield:
These moves are of course correlated with the faith of the US Dollar, which is weakening as the Fed may hold fire on its rate rises for 2015, or even 2016 with the strong bids in the King currency falling in recent weeks.
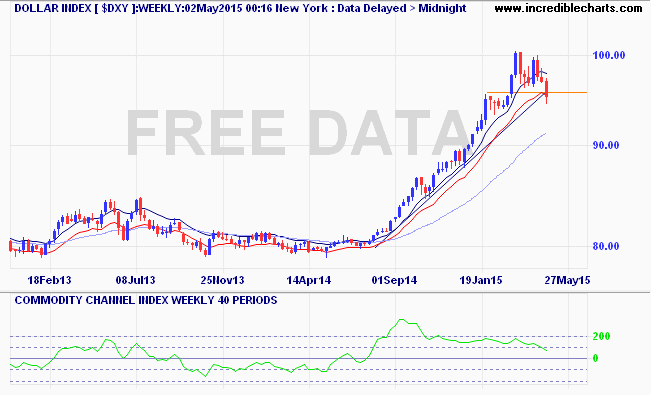
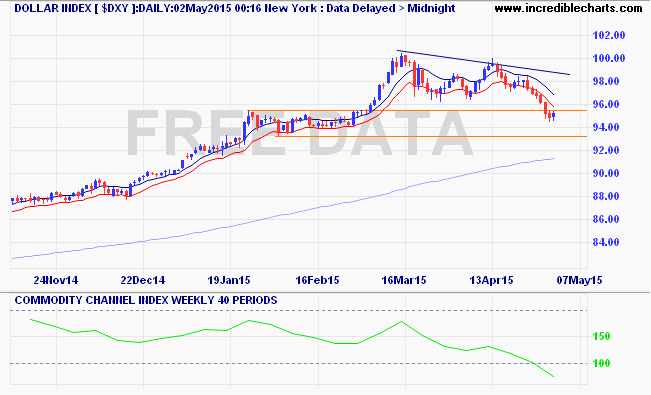
The huge move since September last year from circa 80 to 100 points on the US Dollar Index (DXY) has now fallen through support at 96 points although I expect some bouncing around down to 93 points (the lower orange horizontal line) as this was key support earlier in the year:
On the Euro front, the rising QE seems to be having the effect of strengthening the union currency, moving from 1.05 to 1.13 against the USD since the start of March:
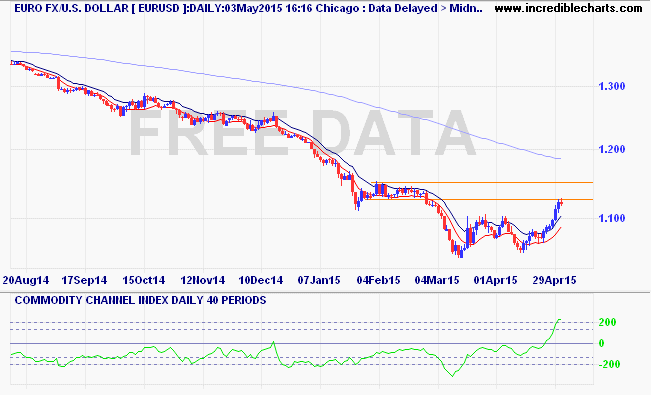
It has now become extremely overbought, ripe for a correction as it hits its own former support, now resistance level at the 1.13 handle. I’m looking for a break through the 1.15 handle as a signal of a new bull market in Euro which could see it take back some of its horrendous losses of last year, but rolling Greek crises put an obstacle in this move.
In Pound Sterling, the Cable (GBPUSD) pair has a very similar picture and indeed maybe forecasting the future move of Euro as it has hit and rejected overhead resistance, turning over on Friday night before finding some temporary support:
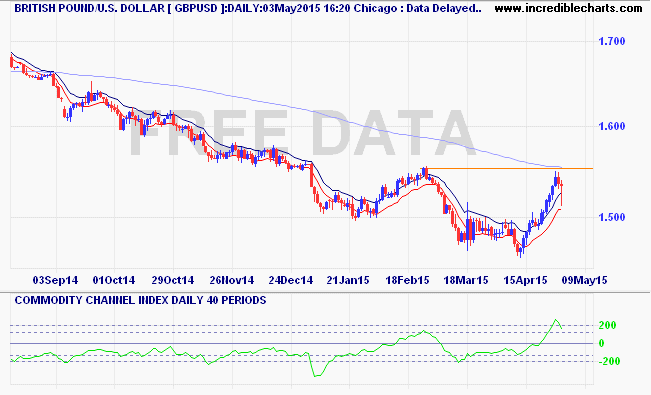
For mine, Cable is likely to range trade up until (and through?) the UK general election and follow any European wider ructions. For now it operates as a splendid trading currency, and not for any longer term positions.
In Pacific Peso land, positioning before the RBA meeting tomorrow afternoon has seen a bull trap eventuate, capturing the optimists out as the AUD soared alongside its non-peers in the undollar world from circa 76 to nearly 81 cents against the USD. It too has hit and rejected overhead resistance and I would contend still provides great opportunity for longer term short holders even if it rallies up to the 82 cent level (corresponding with former resistance on the daily and weekly charts, plus the 200 day moving average):
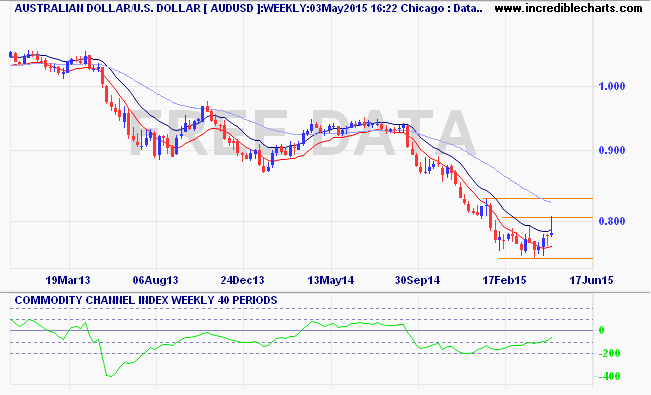
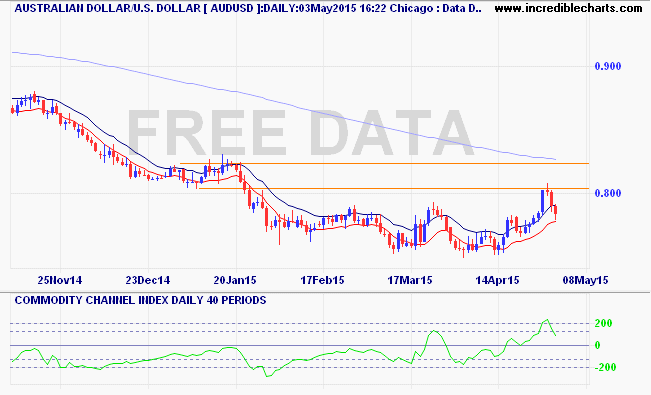
The ride down is not yet over for the Aussie….
In Japan, the very bullish ascending triangle continues to form on the USDJPY with the weekly chart illustrating a very tight point of control around the 119 handle as it wants to break out above the 120 area:
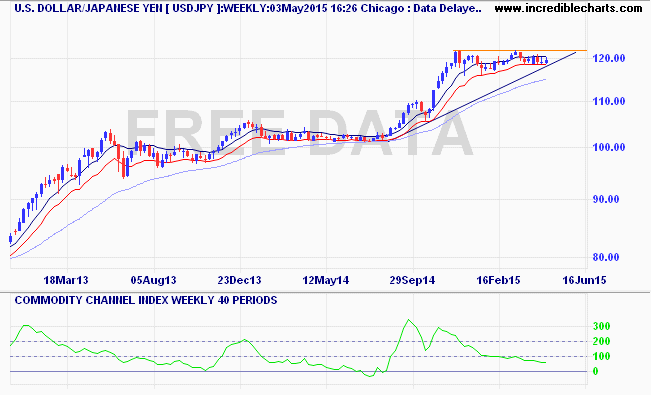
In my daily Macro Morning reports I’ve indicated that Yen remains a longer term proposition with only fleeting intraday opportunities. We’re all waiting (or positioning) for the breakout, or indeed an unexpected breakdown of that long term trend line.
In stock markets, I’d normally post my crude joke of a straight ruler for the Chinese bubbles, but we’ve had a clear pause in the run up in the Shanghai Composite with no returns for the week:
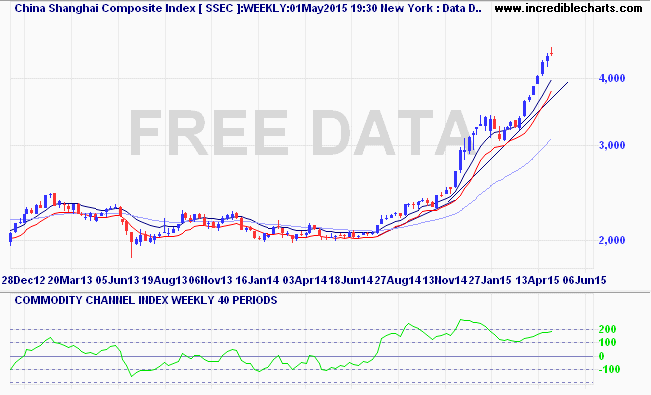
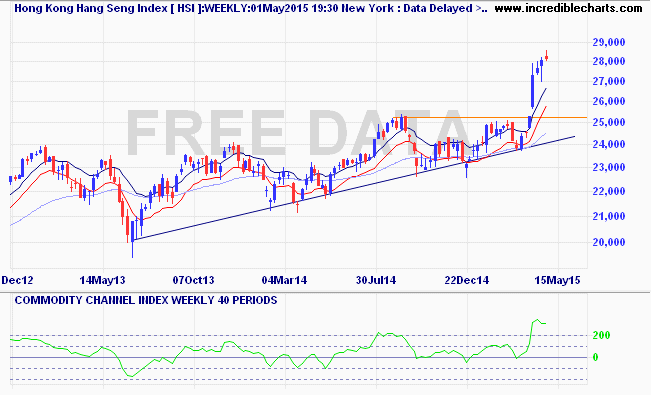
This obviously does not yet point to a top but it does show some steam is coming out of that rice cooker. Looking at the satellite Hang Seng Index in Hong Kong a similar weekly pause at extremely overbought levels (with my preferred momentum indicator at 3 times deviation) may signal further steam coming out this week ahead:
In Japan the Nikkei 225 continues to follow the Yen in lockstep, with a slightly higher bullish bias, but this week some volatility returned on Governor Kuroda’s comments, seeing the index fall nearly 3%:
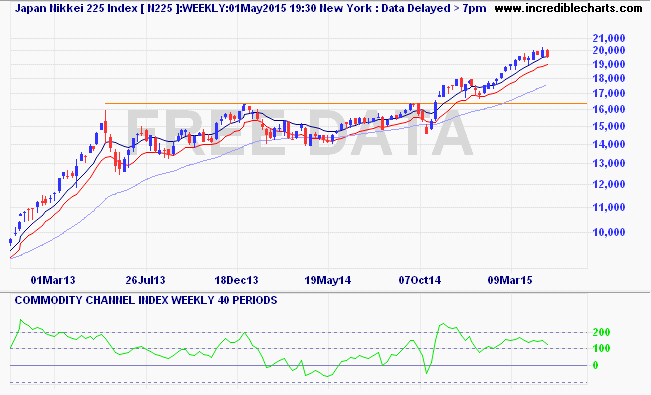
This trend is obviously still intact but like all QE/stimulus induced stock market bubbles around the world, is trying to find that extra hit to get above resistance, in this case 20,000 points (or 120 on the USDJPY) pair. A clear entry point.
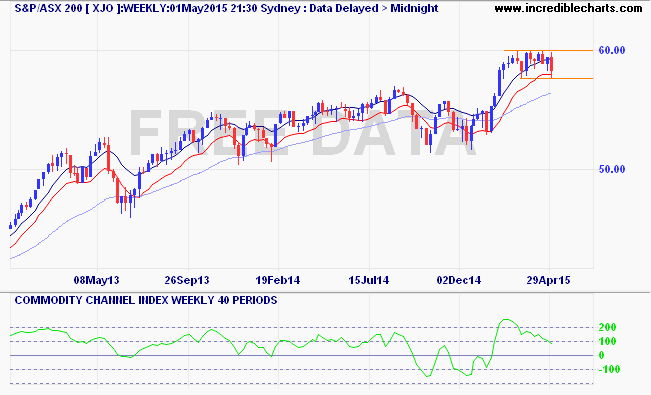
Staying in Asia, the Australian market too wants the extra juice from the RBA which is the only reason it remains highly elevated as the mining boom and commodities prices unwind leaving the thin, emaciated corpse of the bourse behind.
The ASX200 weekly chart below shows a tight range between the psychologically important 6000 point level and support at 5750:
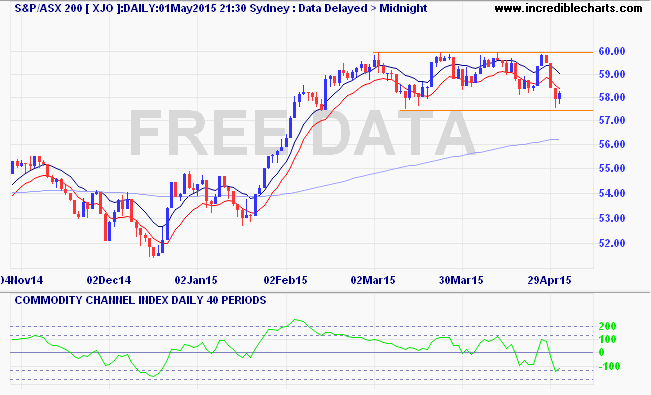
This is only a little bit clearer on the daily chart with the sideways market providing easy returns for range traders and clear entry points (although be wary of falsies!) for the long and short side:
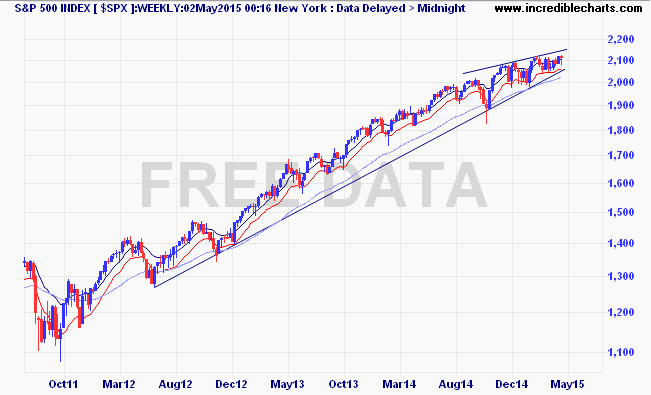
Finally, to the only market no longer being provided with stimulus support, the US S&P500, which has almost finished its quarter earnings pig in the snake where the very high USD has had a material impact of underlying earnings for industrials. The weekly chart is still almost flawless – and unheard of – in its straightness although plotting it in semi-log format does show a distinct rounding top to this bubble:
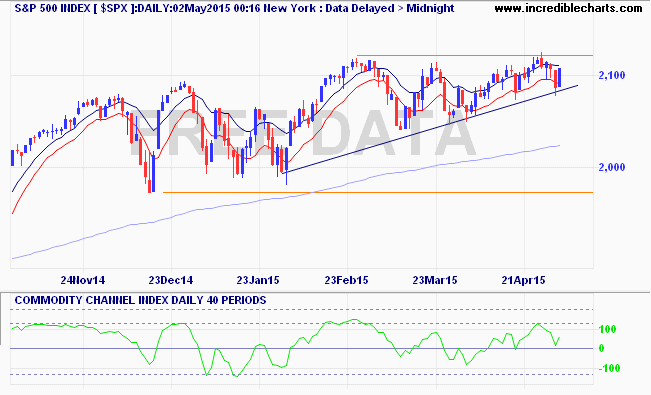
The shorter term picture on the dailies shows rising lows and continued momentum with resistance at 2120 points on the upside, with the bulls still firmly in control here:
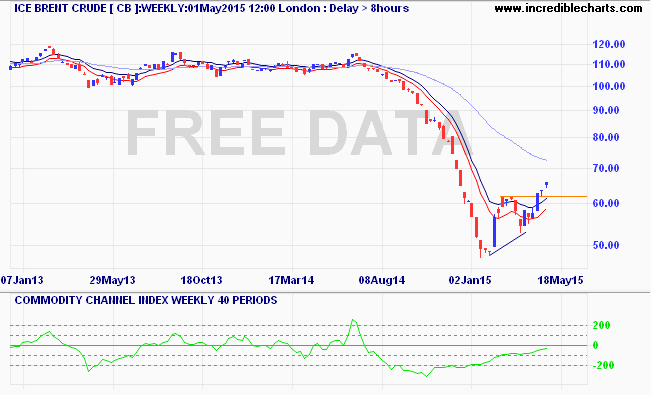
On to commodities and the oil markets continue to do well after their expected breakout from obviously oversold lows. ICE Brent has put on another 4% this week, now nearly 50% off its lowS:
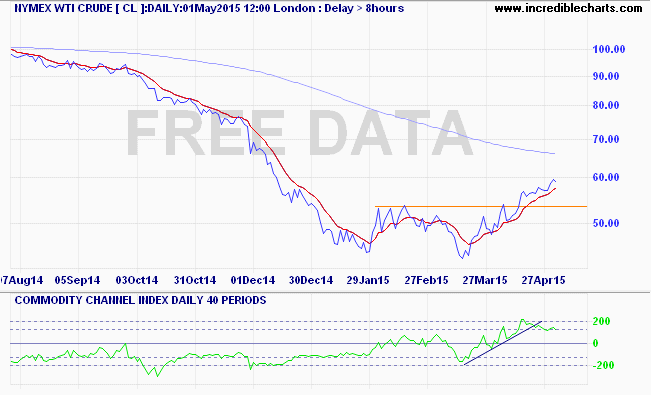
NYMEX WTI crude (the main one I trade) had a nearly identical week, up 3.5% as it approaches the $60USD per barrel marker:
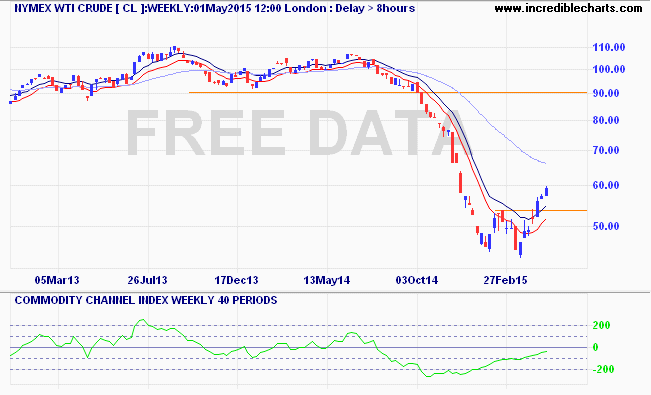
Crude has a lot of hurdles to cross before moving that much higher in my opinion and may undergo a small correction as it comes up to resistance and daily momentum moderates:
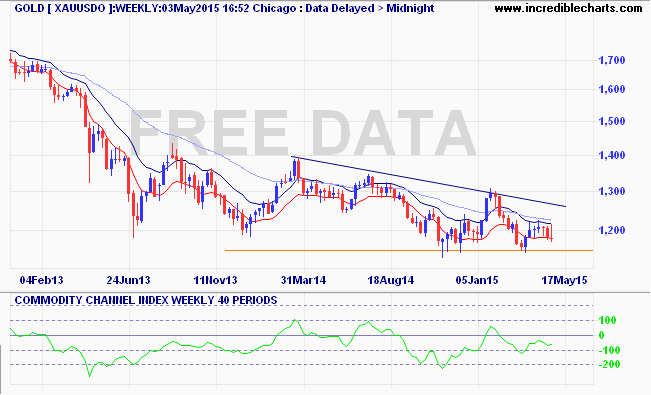
Gold is switching between acting as the true undollar and then following in lockstep but the daily chart is now clearly showing a bias to the downside as it refuses to stay above its point of control at the $1200USD level:
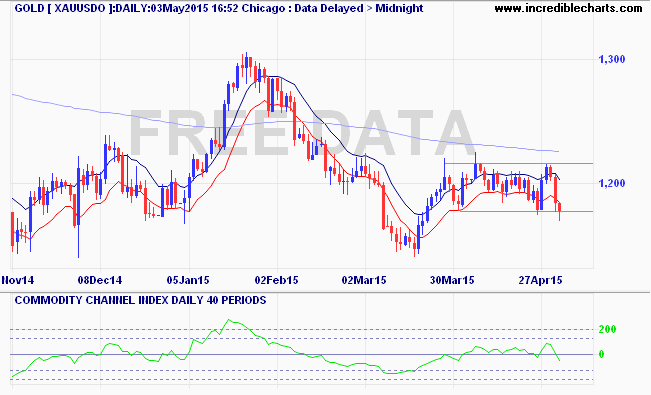
I’m looking (and positioned) for a rollover here down to support at the $1150 level which corresponds to very long term support for the ailing un-currency as it remains steadfastedly in a bear market:
It’s all about jobs this week on the data calendar, with an expected rate cut by the RBA tomorrow afternoon, followed by NZ unemployment and the Chinese composite PMIs on Wednesday. Aussie unemployment follows on Thursday then US weekly initial jobless claims before the all important US NFP on Friday night.