
Cross-posted from The Conversation:
Tax is up every year under this government and tax as a percentage of the economy is higher under Tony Abbott and Joe Hockey than it ever was under the previous Labor government despite all of their huffing and puffing about tax. – Chris Bowen, Shadow Treasurer, interview with Hugh Rimington on Channel 10 Eyewitness News, May 12, 2015.
The $A5 billion worth of tax breaks for small business were a centrepiece of the federal budget this year and something the Opposition was keen to frame as a return to Labor policy.
In a post-budget interview, the Shadow Treasurer described corporate tax cuts and lower tax on small business as a good thing, adding that tax as a percentage of the economy is higher now than it was under the previous government.
Is that right?
The available data
According to data in the federal budget papers, Chris Bowen’s statement is correct.
He refers to “tax as a percentage of the economy”, which I take to refer to tax receipts as a percentage of GDP. This is indeed a standard measure used in economics to summarise the effective tax burden.
Ideally, Mr Bowen’s statement should be checked against independent data sources like the World Bank and Organisation for Economic Cooperation and Development (OECD). But unfortunately, international organisations update their databases with a lag of up to two years. (The World Economic Outlook Database of the International Monetary Fund has revenue data up to 2014, plus estimates and projections until 2019 but doesn’t distinguish between different levels of government or between tax and non-tax revenues.)
When asked for a data source to substantiate his statement, a spokesman for Mr Bowen directed The Conversation to the 2015 budget papers.
Tax on the rise
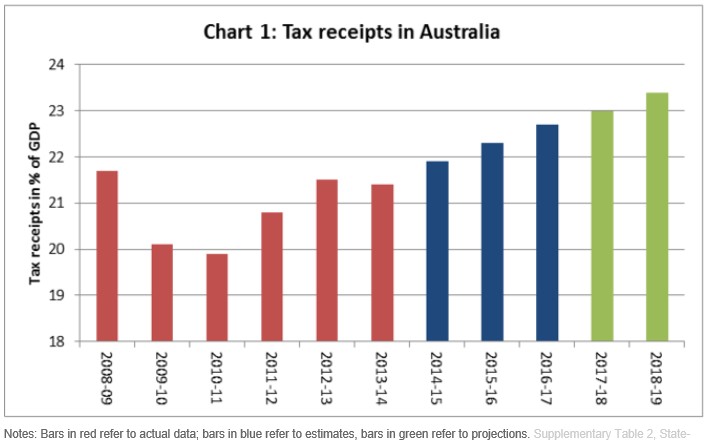
The bar chart below, Chart 1, reports the annual tax to GDP ratio from 2008-09 (the first Labor budget) to 2018-19 (last available projection). It must be noted upfront that data for 2014-15 and the two subsequent years are estimates, while data for 2017-18 and 2018-19 are projections.
If one takes 2014-15 as the reference for the first budget year of the Coalition government, then the evidence indicates that tax revenues in proportion of GDP are higher under the Abbott government than under the two previous Labor governments.
Furthermore, the tax-to-GDP ratio is expected to increase steadily over the next four years.
The table below provides some more detailed information on the structure of the tax system. The data are again taken from Supplementary Table 2 of Budget Paper 1.
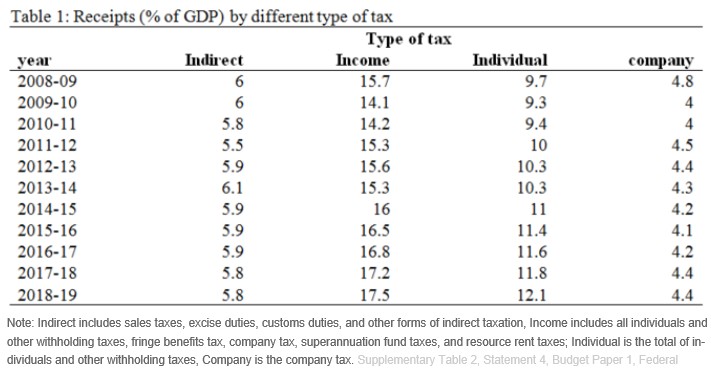
The most evident change that has occurred between the Labor and Coalition budget periods is the increase in income taxation receipts, while indirect taxes have remained fairly constant.
Within the income taxation category, individual taxes have increased, while receipts from the company tax have been substantially stable. Therefore, it appears that there has been a shift in tax burden to the disadvantage of households.
A few qualifications are necessary. First, being estimates, the data for 2014-15 and subsequent might be revised in the future (but I don’t expect these revisions to be significant, at least for 2014-15).
Second, the tax-to-GDP ratio of 21.9% observed in 2014-15 is not the highest ever. Supplementary Table 2 in the budget papers shows that in 2007-08 the ratio was 23.6%. The peak was reached under the Howard government in 2000-01, 2004-05 and 2005-06, when the ratio reached 24.2%. Over the period 1970-71/2014-15 the average ratio was 21.5%.
Third, the data above refer to cash receipts. Accrual receipts in 2014-15 amount to 23.9% of GDP, as shown Supplmentary Table 4 in the budget papers here shows. This is only slightly higher than the accrual receipts to GDP ratio in 2013-14 and 2012-13 (23.7% and 23.6% respectively), but still one to two percentage points higher than the ratio in the earlier years of the Labor governments.
Accrual data also show that tax receipts are expected to increase in the next four years. Therefore, the general picture is qualitatively similar to the one produced from cash basis data.
Verdict
Mr Bowen’s statement is correct. Based on available Treasury data, the estimated tax-to-GDP ratio in 2014-15 is the highest since 2008-09. The ratio is also expected to increase further over the next four years. Therefore, the statement of the Shadow Treasurer is true.
Data for 2014-15 and subsequent years are estimates and projections and may be revised in future.
Lastly, it is worth stressing that this verdict does not establish what level of the tax-to-GDP ratio is most appropriate or desirable for the Australian economy.
In fact, lower taxes do not necessarily lead to superior socioeconomic outcomes, essentially because a government that raises little revenue is also a government that can supply little in the way of public goods, services and social welfare.
For this reason, rather than just focusing on how to reduce the tax burden, the policy debate around taxes should be concerned with finding the tax level and structures that best meet the needs of Australian citizens.
Review
I agree with the data reported and its interpretation. The underlying data of Chart 1 and Table 2 is official Australian Treasury data; with important notes that numbers for 2014-15 through 2016-17 are estimates, which will be revised in the future.
It’s also noted that data for 2017-18 and 2018-19 are projections which assume no policy changes and a return to long-run economic growth.
The principal reason for the growth of Commonwealth taxation receipts as a share of GDP under the Coalition government is the growth of personal income tax. Every individual whose income in nominal dollars increases faces a higher average tax rate as a result of government failure to index, or to change, the brackets of the personal income tax rate schedule. This effect of so called “fiscal creep” is in addition to the effect of some people facing higher marginal income tax rates. – John Freebairn
Article by Fabrizio Carmignani, Professor, Griffith Business School at Griffith University, and John Freebairn, Professor, Department of Economics at University of Melbourne
