
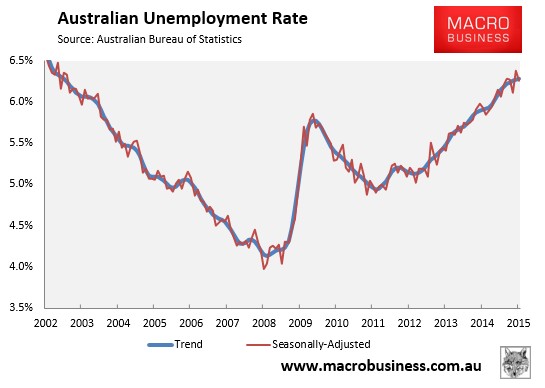
As summarised earlier, the Australian Bureau of Statistics (ABS) today released labour force data for the month of February, which registered small decline in the headline unemployment rate (from 6.4% to 6.3%). The result was in line with analyst’s expectations. In trend terms, the unemployment rate was also steady at 6.3% in February – still the highest unemployment since July 2002 (see next chart).
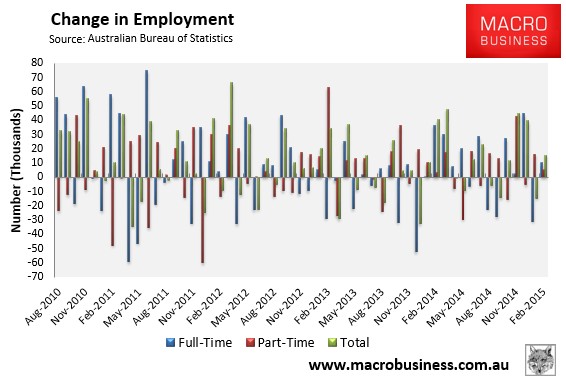
Total employment increased a seasonally adjusted 15,600 to 11,652,400, with full-time employment increasing by 10,300 to 8,062,000 and part-time employment increasing 5,300 to 3,590,400.
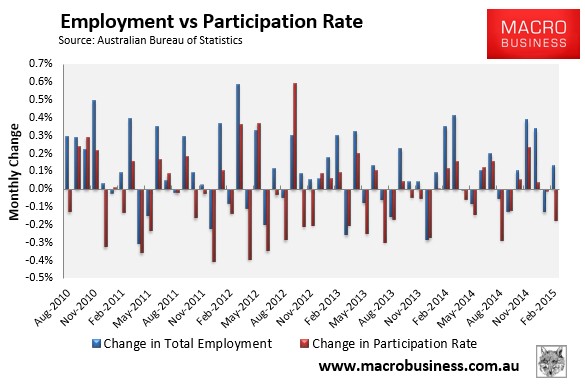
The Participation rate decreased 0.1 pts to 64.6%, which is part of the reason why the headline unemployment rate fell.
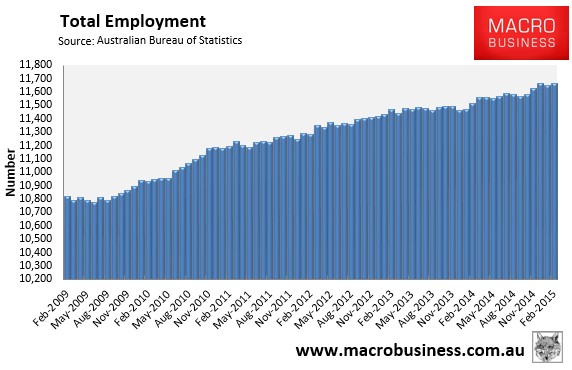
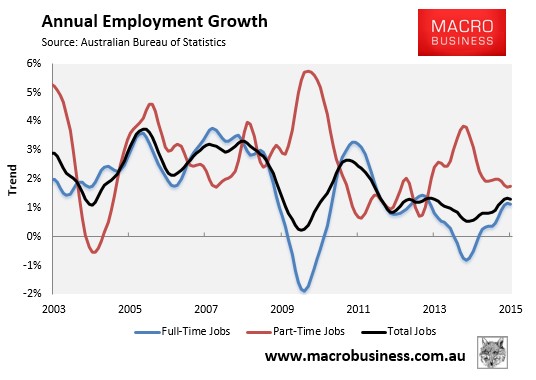
The trend in total employment remains weak, particularly in light of the ongoing strong population growth (see next chart).
Full-time jobs growth (1.1% seasonally adjusted and trend) remains weak, despite recovering over the past six months (see next chart).
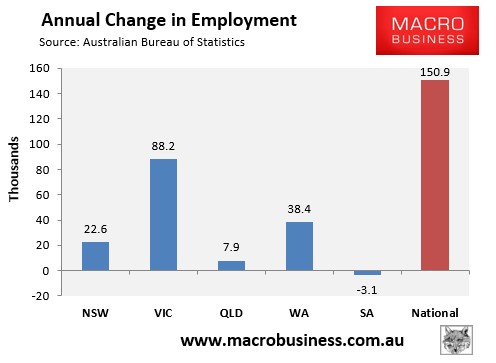
Surprisingly, Victoria has driven jobs growth over the past year in seasonally adjusted terms. By contrast, South Australia has shed jobs over the past year and Queensland has enjoyed minimal employment growth (see next chart).
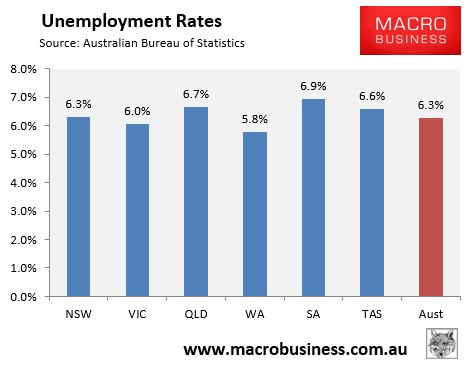
And South Australia and Queensland now have the highest seasonally adjusted unemployment on the mainland, whereas Western Australia and Victoria have the lowest (see next chart).
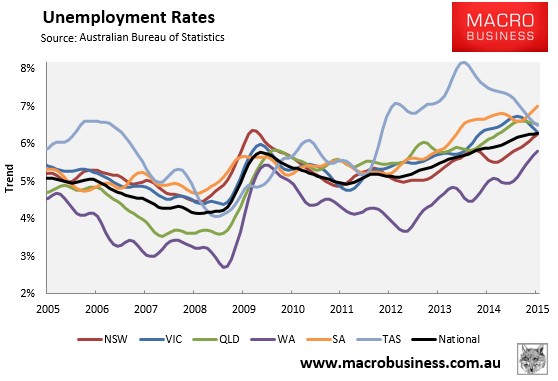
The state seasonally-adjusted figures are notoriously volatile and subject to a big margin of error. As such, the below chart shows the ABS’ trend unemployment rates, which shows Western Australia with the lowest unemployment (but rising), South Australia with the highest, Tasmania and Victoria’s improving, and New South Wales deteriorating. Note also that the national unemployment rate (6.3%) is also trending upwards, albeit slowly:
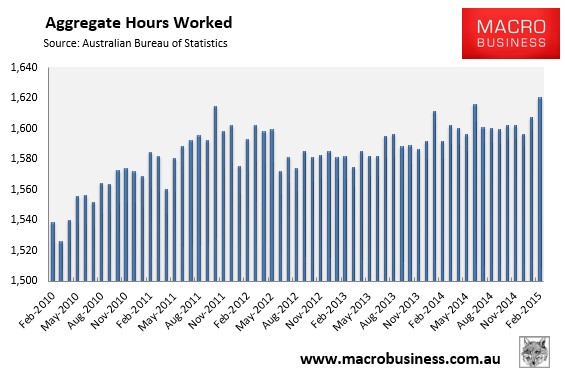
One big positive from this release is that the aggregate number of hours worked rose sharply in seasonally adjusted terms in February (up 18.0 million hours or 0.8%). It has also risen by 1.8% over the past year, which is just above the circa 1.6% growth in the population:
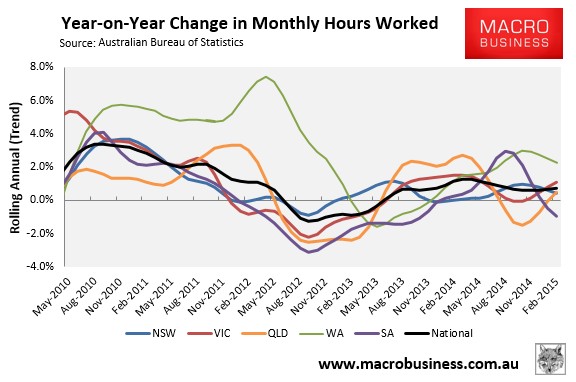
However, the below chart, which tracks the changes in hours worked on a trend basis, shows a mixed bag across the states and only a moderately improving trend nationally (+0.7% YoY):
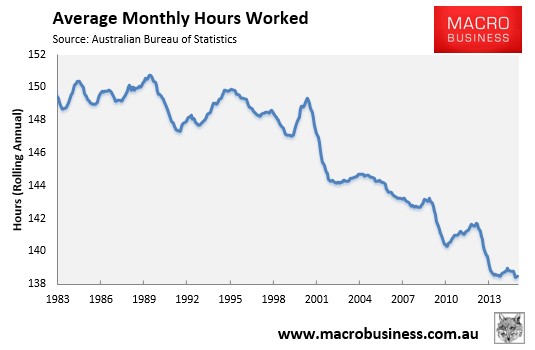
The average number of hours worked remains near all-time lows:
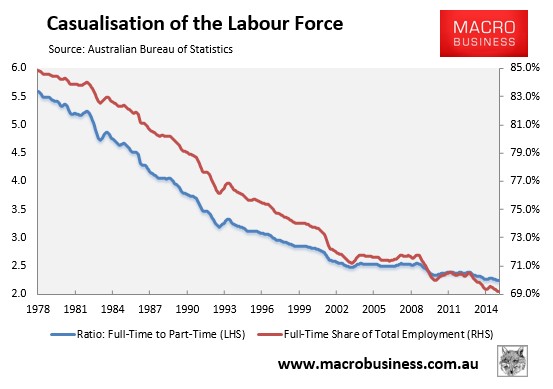
The share of full-time jobs is also at an all-time low:
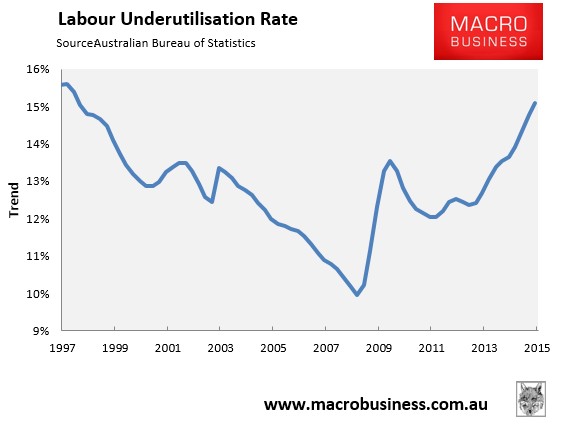
And the labour underutilisation rate (15.1%) has hit the highest level in nearly 18 years:
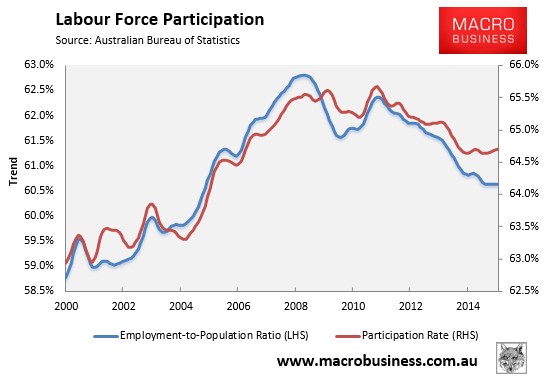
At least the participation rate is recovering, and the employment-to-population ratio has leveled-out:
Finally, to round things out, the next chart summarises the annual change in the key employment aggregates on a seasonally-adjusted basis:
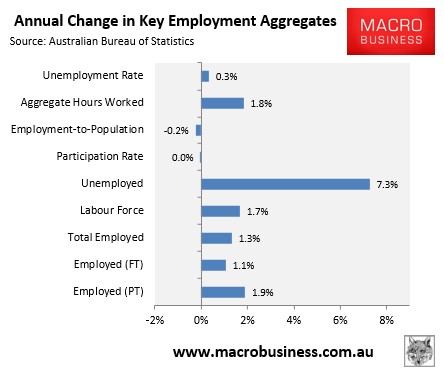
As you can see, the overall labour market remains soggy with employment growth insufficient to soak-up the increased labour supply from the population ponzi, and unemployment and underemployment still trending up.
