
Here’s a bit of fun. I’m no card carrying technician but the action in RIO has been interesting this week as its price underperforms the general risk rebound. It’s down again today trading at $57 on soft foreign leads despite the rise in the iron ore price and a glance at the daily chart suggests further weakness may be ahead:
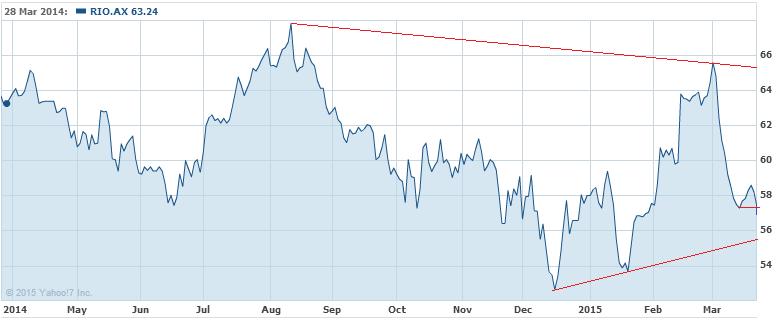
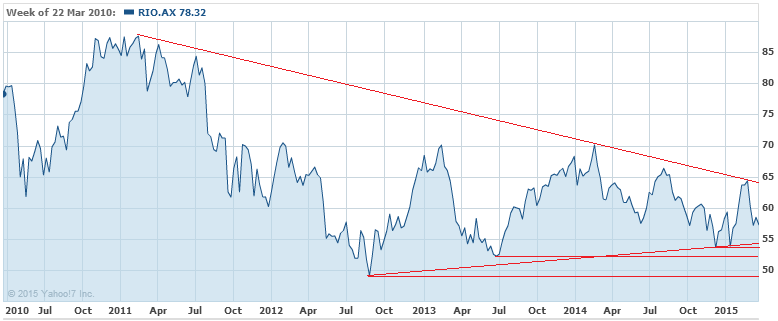
RIO has fallen through its recent selloff low in the mid $57s and appears likely to retest its 2015 uptrend line that began with a convincing and bullish double bottom. The weekly chart is more bearish:
Advertisement
This pattern could either be a neutral symmetrical triangle or a much bigger bearish descending triangle. I’d opt for the latter.
