
The Reserve Bank of Australia (RBA) yesterday released real household disposable income (HDI) data, derived from the December quarter national accounts (released Wednesday), which revealed that real per capita HDI rose by 0.2% over the quarter and was up by 0.1% over the past year (see next chart).
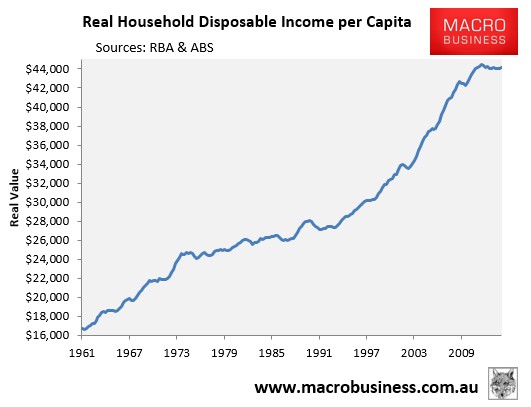
As shown above, Australian households are experiencing the biggest income shock since the early-1990s recession, with per capita real HDI falling since June 2012, down 0.7% over that period.
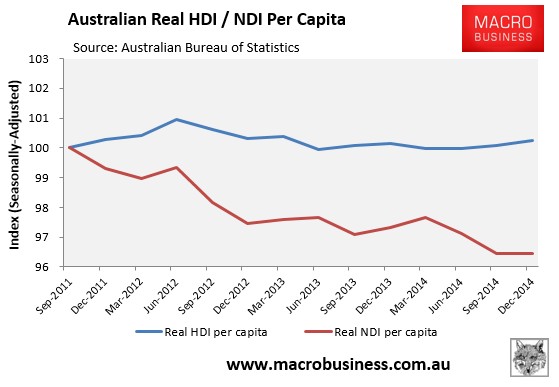
However, real per capita HDI has held-up much better than national disposable income (NDI), which has been falling since September 2011 in seasonally-adjusted terms, down 3.5% in real per capita terms over that period (see next chart).
The resilience of HDI is explained by household’s increased share of output, as shown in the next chart:
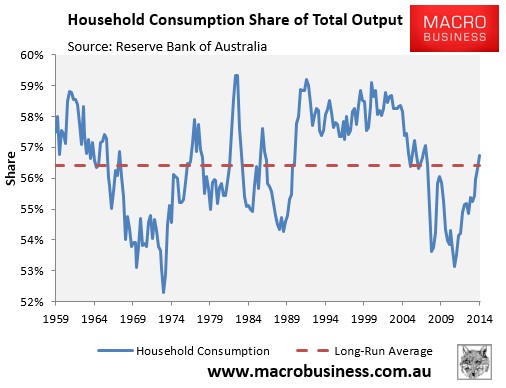
As you can see, household consumption’s share of output has risen strongly since the GFC and is now tracking just above the long-run (55-year) average. This suggests that HDI could continue to track better than NDI for a while yet – at least as long as household’s continue to increase their borrowings (reduce their savings).
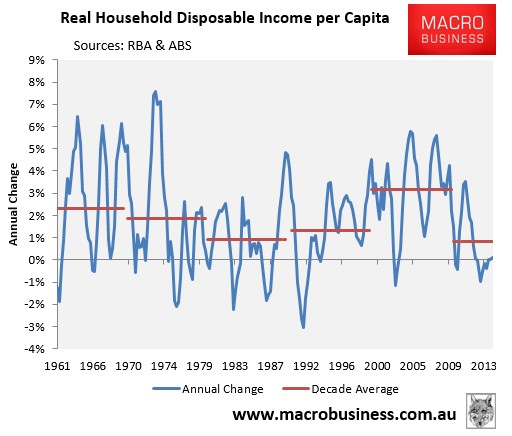
That said, the growth in real per capita HDI so far this decade remains anaemic at just 0.8% per annum, which is lower than the 1960s (2.3%), 1970s (1.8%), 1980s (0.9%), 1990s (1.3%), and 2000s (3.2%):
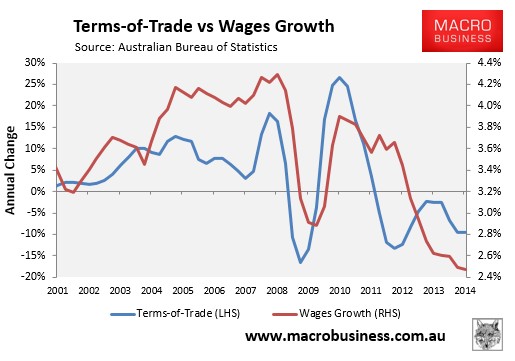
And with the terms-of-trade continuing to trend lower, HDI growth will continue to remain weak, even if it does manage to hold-up better than national income. The next chart, showing the terms-of-trade as a leading indicator for wages growth, would seem to support this view:
unconventionaleconomist@hotmail.com
