
by Chris Becker
I’ve always said that volatility does not equal risk – it provides opportunity. And after last nights slap by the Swiss Central Bank, removing the CHF peg to the Euro, volatility is raising its “ugly/beautiful” head again providing a multitude of opportunities for the year ahead.
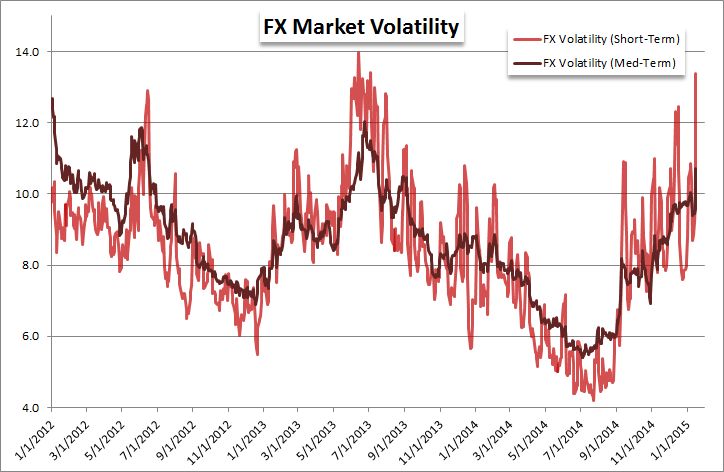
Here’s John Kicklighters FX volatility chart going back to 2012, clearly showing that lower periods of volatility beget sharp higher periods (a Minskian observation):
For stocks, the CBOE Volatility Index or VIX is the clear barometer:
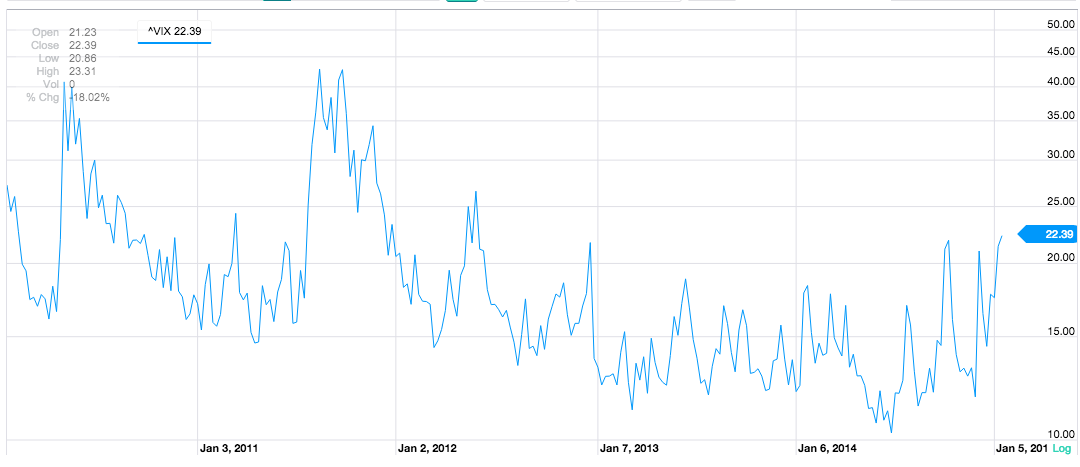
The VIX was up 4% last night and has risen all throughout 2015 so far. The quiet period of volatility since the beginning of QE2 in August 2011 has now reversed as QE3 ends. The ECB might be able to “save” European stocks next week with a mammoth QE program (or enact a Black Swan by doing nothing!) but as US stocks continue to tumble and sit at critical support, the long only crowd are getting nervous.