

by Chris Becker
Today’s chart comes via Bloomberg, chronicling the fall in WTI crude, the Aussie 10 year bond yield (as I reported in a recent COTD post here) and the not-often mentioned Aussie 3 year inflation swap:
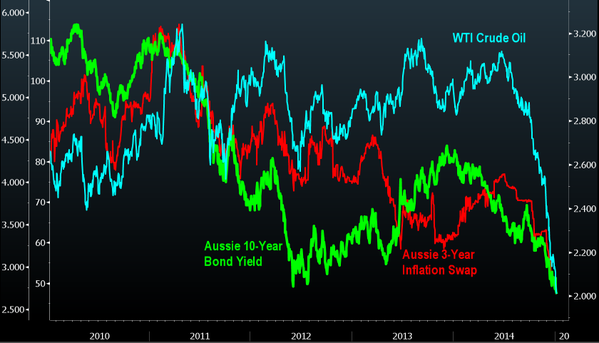
What does it all mean and are we just confusing correlation with causation here? No, as any non-biased observer of the Australian economy will tell you, the country’s fortunes are completely linked with that of the speculative commodity complex.
What the interest market is confirming, via the swap (a fixed rate swap for future change in CPI) and bond yield curve, is is that future inflation is completely off the table.
The reversion of the Terms of Trade and the fallout from the mining construction boom, with rising unemployment, household income in recession and a Federal budget reluctant to expand as rating agencies hold a virtual deadline on public debt reinforce the market action with macro reality.
More from Bloomberg:
Central banks around the globe are seeking to adjust to weaker-than-forecast inflation, allowing policy to stay loose for longer. RBA Governor Glenn Stevens has held rates at a record low since August 2013 to spur housing construction and soak up unemployment in the mining industry.
Australia’s benchmark 10-year yield, which is the highest among AAA rated nations, rose five basis points to 2.73 percent as of 1:19 p.m. in Sydney after dropping by 150 basis points in 2014. By contrast, the U.S. yield was 1.99 percent, Japan’s was 0.3 percent and Germany’s was 0.48 percent.
Australia’s consumer-price index climbed 2.3 percent in the third quarter from a year earlier, the slowest pace in a year and down from 3 percent the prior three months. The central bank aims for average inflation of between 2 percent and 3 percent.
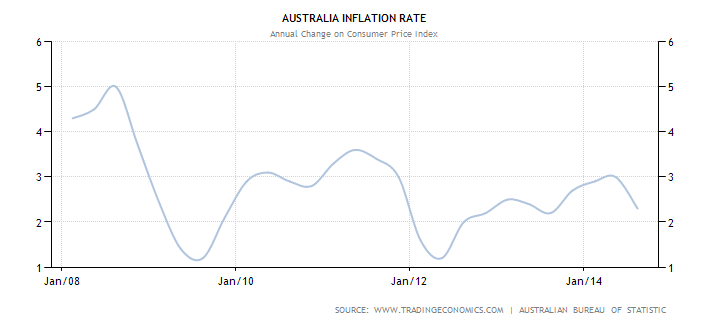
The impact of lower oil prices will probably take the headline CPI rate below 2% for the first time since 2012 and mid 2009. The cycle above is quite obvious and the headwinds have only just started.
A Deutsche Bank AG index that tracks the prices of commodities important to Australia slid 29 percent in 2014 with iron ore and thermal coal touching 5 1/2-year lows. The RBA’s trade-weighted index for the local currency declined 4.4 percent over the past 12 months. The Australian dollar was at 80.93 U.S. cents after sliding to 80.35 cents on Jan. 5, the weakest since July 2009.
The Aussie is forecast to trade at 80 cents by the end of 2015, according to analysts surveyed by Bloomberg News.
“The Australian dollar has not weakened enough and inflation expectations will remain in check,” said Shimomura at Mitsubishi UFJ Asset. “The spread between long-term yields in Australia and the U.S. is likely to narrow further as potential growth in Australia will be weak.”
Indeed. But what about tradable inflation and the fall in the Aussie dollar? After spiking last year, there has been a turnaround:
Non-tradable is falling off a cliff quickly, and we’ll know soon enough at the end of the month when the ABS prints its quarterly CPI figures if tradable has followed. The correlated falls in AUD and commodities, especially energy, has reduced input prices and the pain at the pump significantly.
The much-waited for inflation breakout that many mainstream economists alarmed about when the more prudent called for the RBA to bring the dollar down from its speculative lofty heights has failed to materialise.