

Welcome to MB’s final special report for 2014. It is for paid subscribers (not trialees) so get yourself a sub today and Merry Christmas!
______________________________________________________________________
by Chris Becker
Its been an astounding year trading markets in 2014 with some tremendous bubbles and eye-popping crashes. As we head into Christmas with a Russian and emerging market currency crisis, energy and commodity markets in turmoil and stocks rising and falling 2% a day who knew it was going to be such a volatile 2014?
In this report I want to go over the big movers, not the outliers or tiny speculative stocks, but the major markets, currencies and commodities whose price dynamics have far reaching consequences, but can also be captured by the average investor.
Currencies
The first cabs off the rank are FX/currencies, with US Dollar dominating the moves as it strengthened as the third round of QE was implemented, tapered and finished. Patience has been the name of the game with no significant breakout in the USD until mid year, which saw a broad 10% appreciation as shown on the Dollar Index daily chart below, moving from 81 to 89 points:
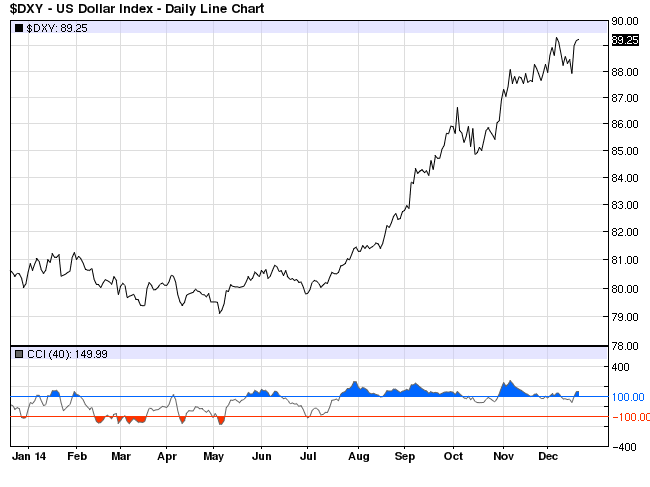
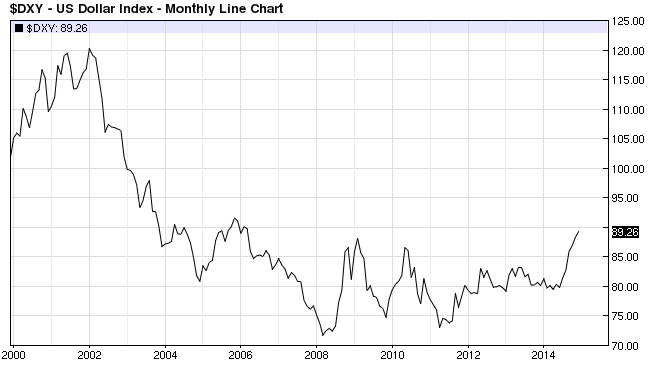
This move has been brewing for a long time with fractal analysis of the monthly price chart and of the constituents separately (i.e Euro, Aussie etc) showing the seismic shift in USD strength after a near decade of weakness as the currency wars start to take their toll with the US economy leading the way.
There were a number of ways to catch this move, which had various magnitudes in the major pairs. Yen weakened considerably this year, down over 20%:
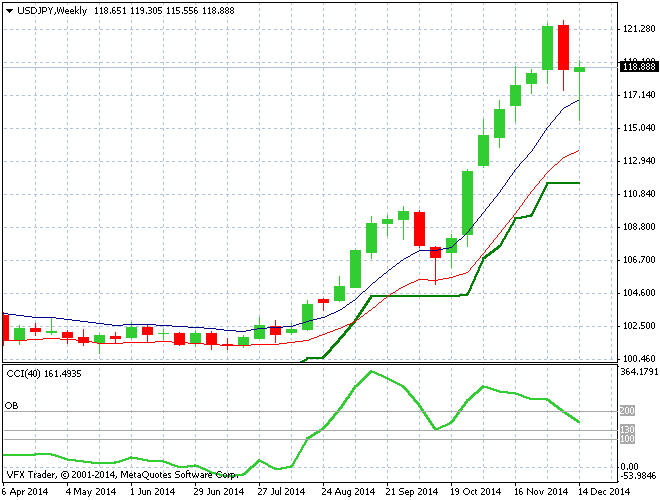
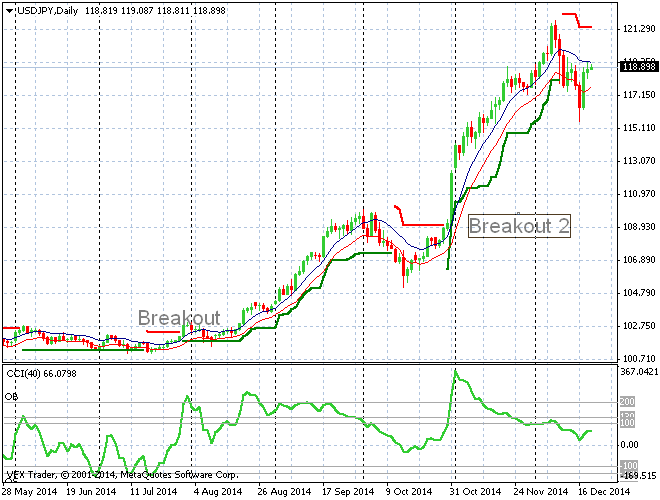
USDJPY increased from 102 to 122 from July to December on a clear weekly breakout with an uptick in both volatility and momentum. The daily chart provided two successful entry points using breakouts (with two false entries or whipsaws depending on your risk stop in March and June) to capture most of this move on an end of day basis:
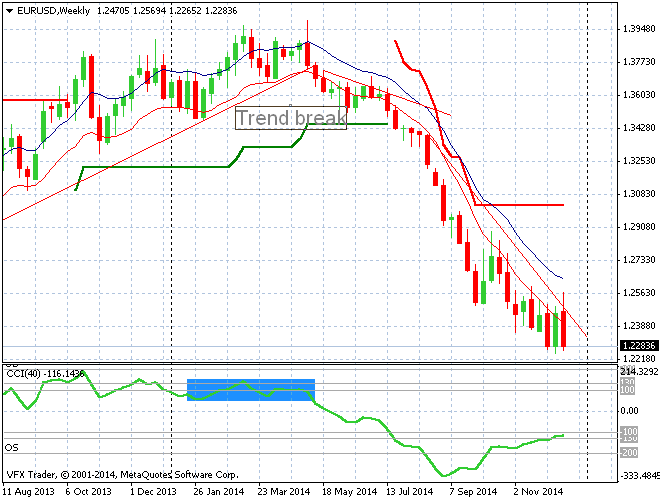
The monthly trend in Euro was weak coming into 2014 and could not be sustained past the mid year. The usual turndown in May/June accelerated, breaking the 2013 trendline and brokedown completely in the northern Summer in July as EURUSD dropped from 1.34 to 1.23:
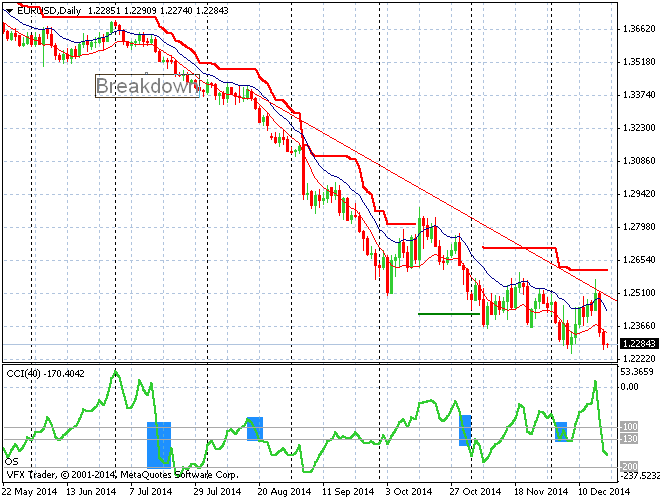
Again the daily chart provided multiple occasions to short Euro on its downtrend, save a large uptick/short covering rally in late September with a re-entry thereafter (negative momentum marked below in the blue rectangles):
Pound Sterling had to weather the Scottish referendum during the year but before that 2014 was shaping up as one of strength versus the USD as it climbed from 1.64 to 1.71 in a relatively smooth weekly uptrend that provided lots of opportunities to go long:
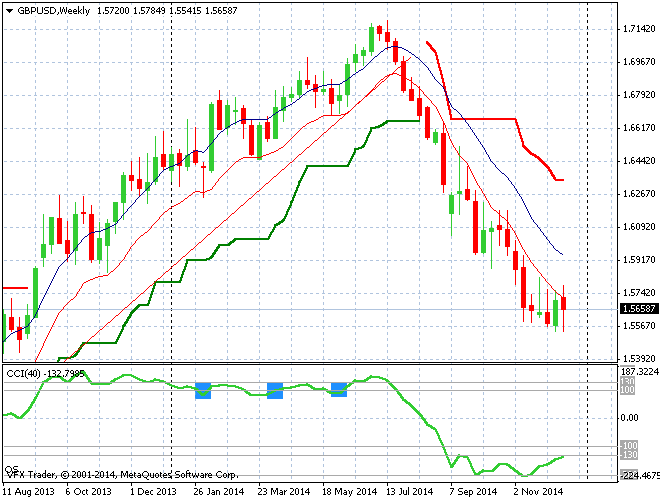
Then it cracked, breaking the uptrend line in early July and fell in quite orderly fashion down to 1.55 where it has found a temporary base going into 2015. The daily chart shows the extreme volatility around the Scottish referendum which then provided another opportunity to short throughout the latter half of the year, taking profit on the oversold/stagnant conditions.
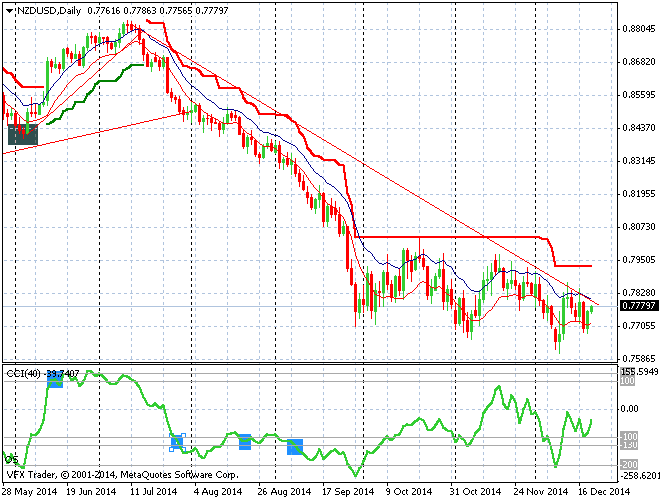
Moving back to Asia and look at the Kiwi which for the last two years had been range trading between 77 and 86 cents against the USD although like other pairs began to strengthen in the first half of the year, mainly on the back of rate rises by the RBNZ. However a combination of jawboning by the RBNZ Governor and market forces made the Kiwi fall out of bed swinging from 88 to 77, its 2013 low, where it sits coming into Christmas:
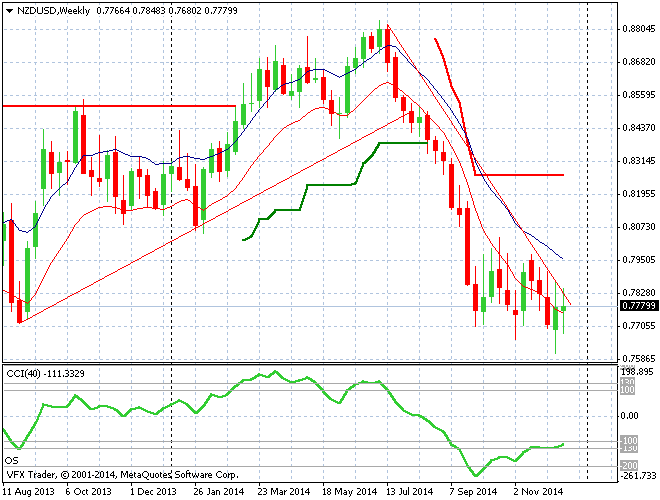
For mind the daily chart of NZD shows its higher daily volatility (or average true range) and choppiness can be a hindrance at times, especially against the crosses too like AUDNZD. As a result I usually trade NZDUSD from a four hourly timeframe or zoom out to the weeklies for position trading, or use patterns to discern the next trend.
There were two major uptrends in the start of the year in February, anticipating the March rate rise and in June for the last rise of the year, that were captured by large breakouts above daily volatility ranges (the red upper line indicator on all charts, green being the breakdown point). The real move was the breakdown in July from 87 to 77 from July to December:
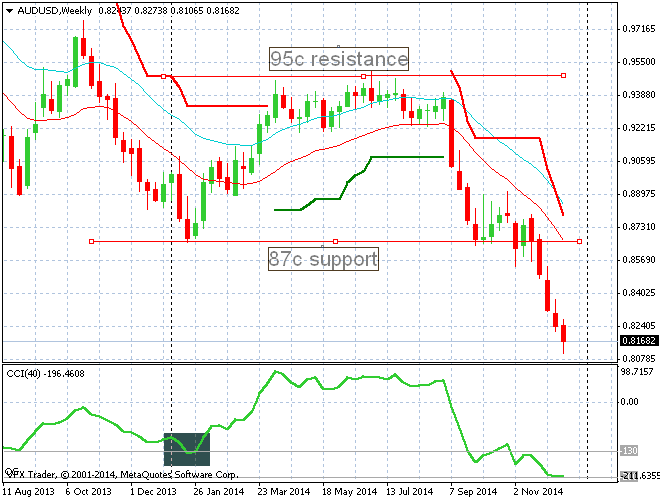
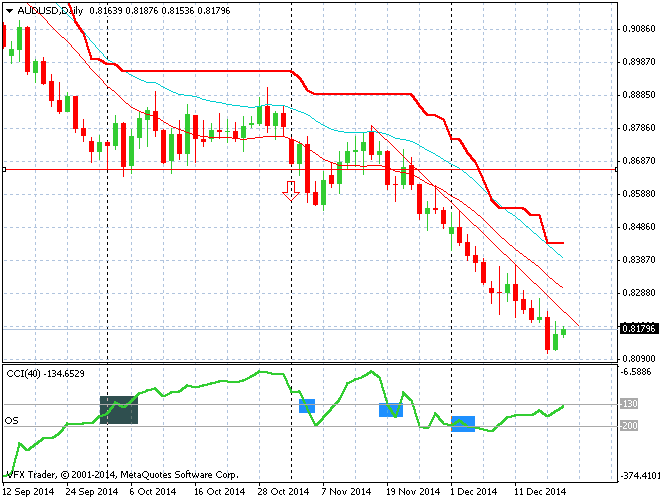
We end on the great Aussie battler – AUDUSD. It came into 2014 already weak as it broke its post-GFC trend the year before, dropping below parity and struggling to find a base at 90 cents. Like the Kiwi it started with an upswing from oversold levels, rallying from 87 cents to nearly 95 cents where it stagnated for most of the mid year before breaking down as the commodity complex came apart.
There are two trades of note here, the breakout in February and the breakdown in July. Both played out well on daily charts alone, with the former breaking out strongly against the daily range with a positive RBA Tuesday statement before taking off as the market realised no more rate cuts were on the table.
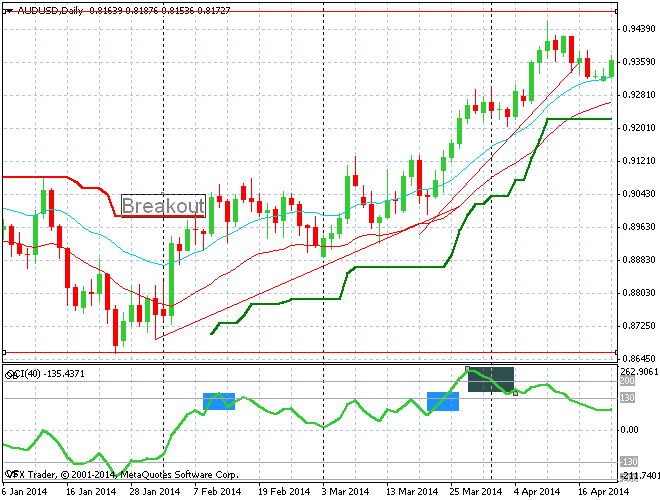
A few re-entry opportunities on this one and then a take profit on oversold conditions in mid April netted a 400-500 pip move. But it was the breakdown that was explosive! After slipping along and then beginning to ease below the 93 handle in July, the curtain was dropped sharply through 92 and then straight down to monthly support at 87 cents where it steadied for awhile:
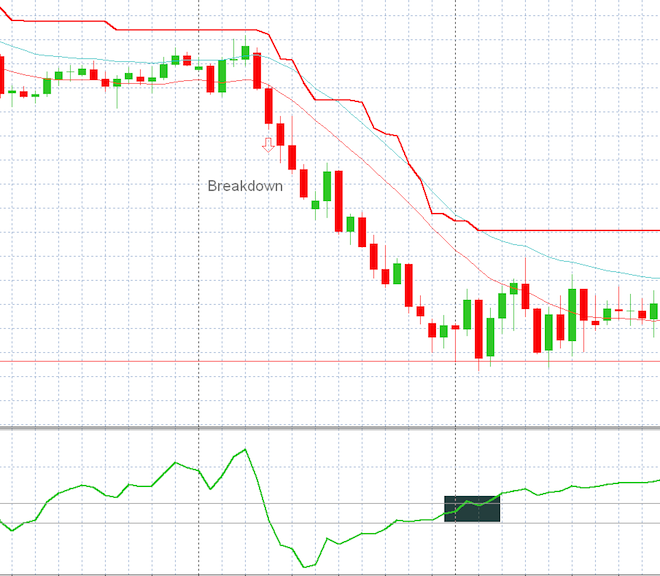
Before resuming its downward trend providing multiple opportunities to go short (any close below the high moving average would do it) for another circa 500 pip trade before Xmas:
The takeaway for FX in 2014 is the strengthening USD could have been played in your own currency – Australian or New Zealand – or in bets against the Pound or Euro or Yen with strong levels of success. It didn’t require complex strategies or multi factor models or sitting in front of a computer for hours on end intraday either, as end of day or even end of week strategies could capture one of the biggest macro moves of the year.
Commodities
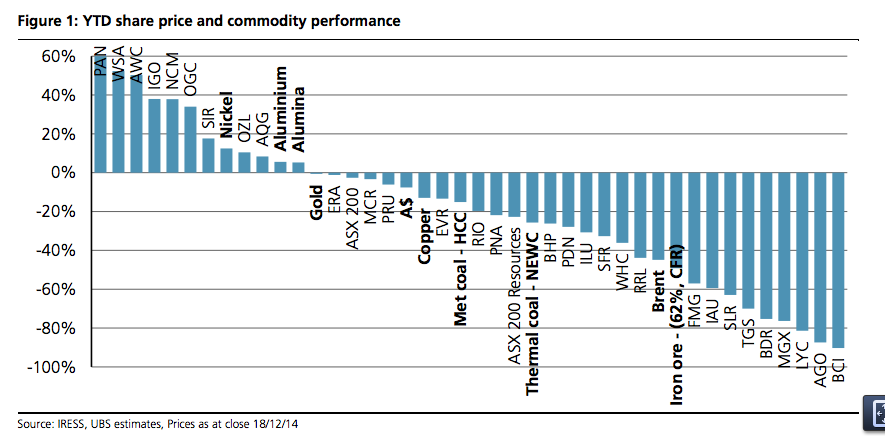
Gold only provided a handful of opportunities this year, in comparison with the rest of the commodity complex, whose annus horribilis can be summed up in one chart (courtesy of UBS):
But for the shiny metal, which had its own horror year in 2013, falling from $1600 to $1200USD per ounce, the duality of its relationship with USD came the fore again with an AUD-like rise in February to March and a similar decline in the last few months. These weren’t big moves in the scheme of the secular bear market where gold finds itself, but significant in and of themselves.
The daily chart spells this out clearly with a two-stage swing-based rally going from terminal support at $1200USD per ounce up to nearly $1400USD per ounce:
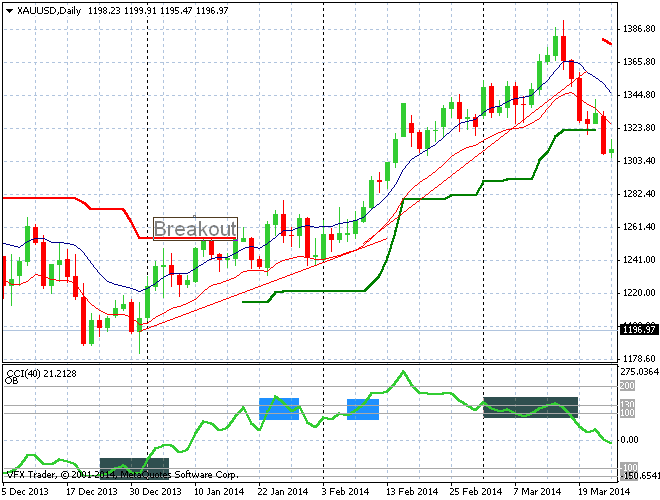
The oversold conditions in the new year lead to a daily volatility breakout and then ample opportunity to get on board with strong daily momentum before the overbought blowout. I measure this by two standard deviations (or a +200/-200 reading) as a warning on my preferred momentum indicator, CCI.
With most of the mid-year a swings and roundabout affair with a potential breakdown in May fizzing out, it took a stronger USD to slowly applying selling torque to the gold complex as it fell from $1350USD per ounce down back to $1200USD where the picture remains fuzzy, if a little bearish currently.
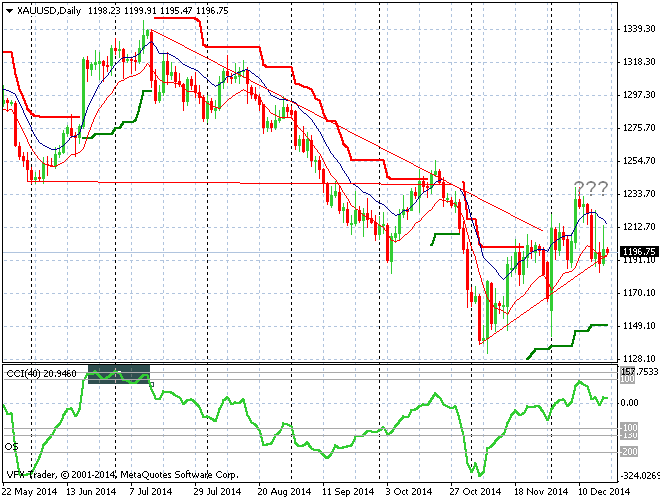
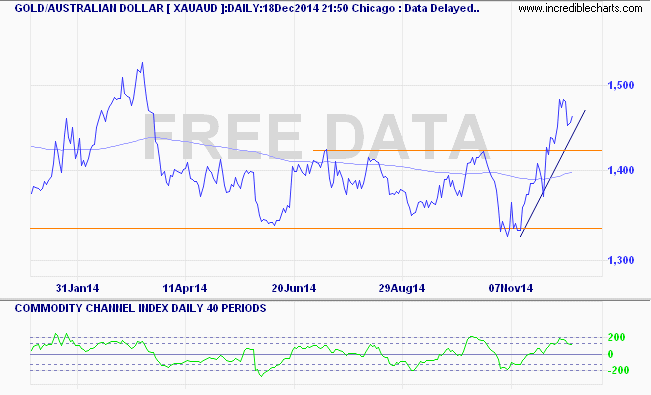
This move was confirmed as it went through a new yearly low at $1250 and subsequent price action showed a lower timeframe (4 hourly preferable) for capturing the quicker moves, or remaining net short over the long run. The only exception is holding gold in Australian dollars although the current rally has some way to go before clawing back losses of previous years:
The moves in silver were much more dramatic due to its industrial utility compared to gold, as all commodities were sold off, starting the year at $USD20 per ounce and finishing just below $16 with one major breakdown to play:
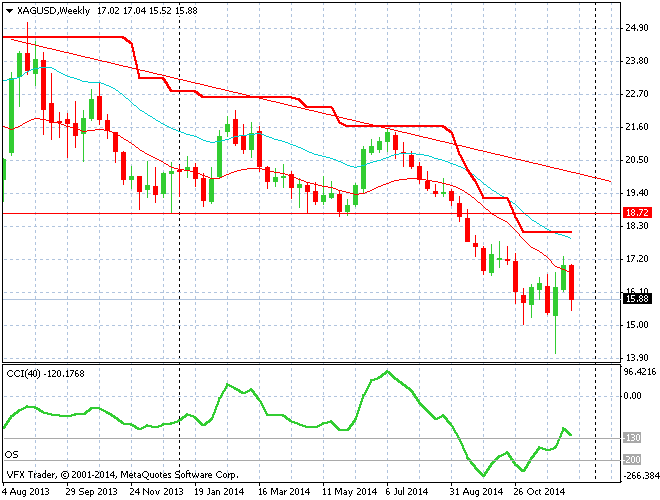
The weekly chart shows the steady downtrend from 2013 and the horizontal support at just below $19 touched briefly throughout the year until the breakdown in late August that was preceded by a swing short in July on the dailies:
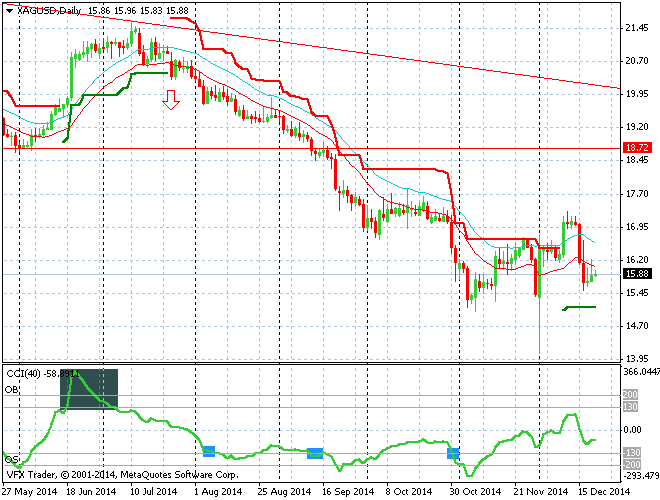
In one trend lasting only a few months a near 40% downmove was captured as silver dropped $4USD per ounce, providing lots of opportunities (note the blue boxes showing negative momentum crossovers) to enter new shorts on the way.
And now we get to the big kahuna – oil. Leading up to this year, the technical picture for oil post GFC was a symmetrical wedge pattern on the weekly and monthly charts, the top of which was formed by the QE2 surge, the bottom the “buy the dip” speculation on a bullish supply/demand dynamic:
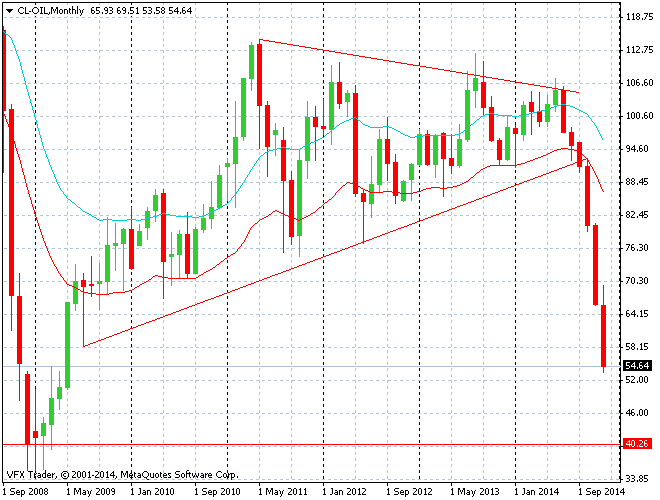
2013 provided some breakout opportunities in WTI and 2014 was shaping up to be similar with resistance overhead at $106-110USD per barrel. As resistance was rejected after a fakeout, oil quickly broke down through weekly and daily volatility measures before cracking the all-important trendline from the GFC lows:
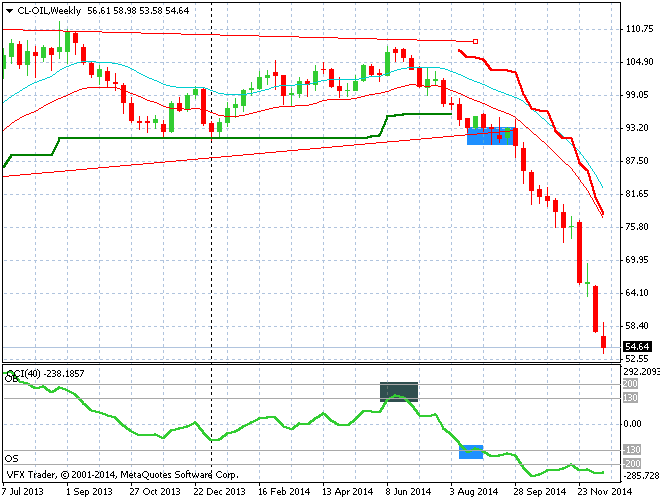
By merely shorting the trendline break at $93USD per barrel, the current move equates to a 44% nominal profit as it remains below $55 per barrel as of Friday the 19th. A super move that also took out the likes of Santos (STO), Woodside (WPL) and Oil Search (OSH) in varying magnitude.
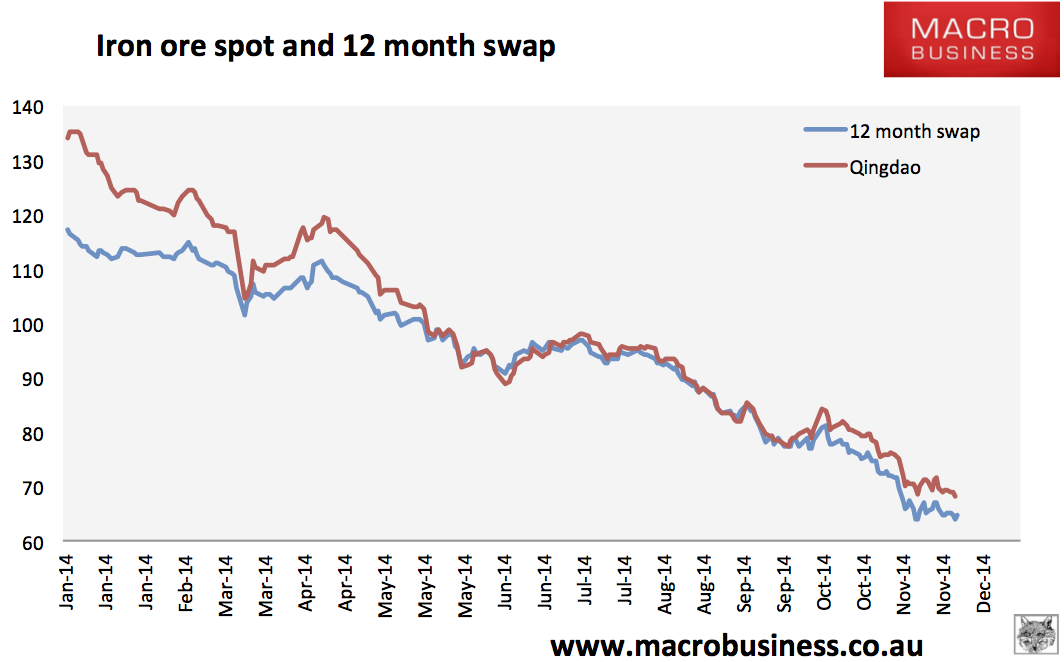
Iron ore was the right hook to this one-two punch on global commodity markets halving over the year and taking Fortescue Metals with it:
Playing the FMG short game has been quite simple this year, compared to 2013 with no restocking to contend with and strong price action. After the overbought trend following the restocking of 2013 (a 100% rally!) the price fell below its weekly low moving average and momentum diverged strongly setting up the first swing trade in late March.
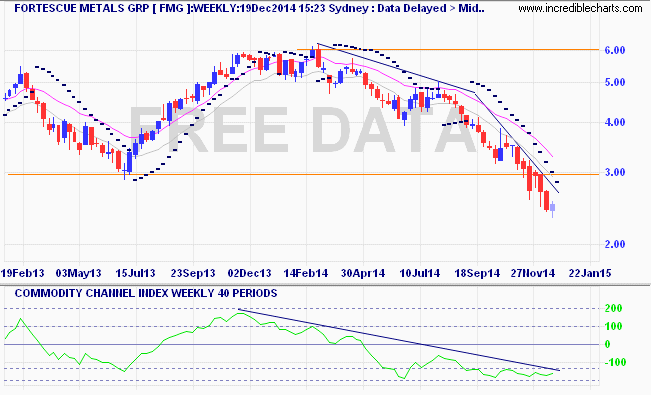
By then, 12 month swaps had priced in serous falls ahead as momentum turned, there were plenty of opportunities to join the short crowd with an acceleration after the inevitable short covering base in August just above $4 per share. And then capitulation below the 2013 low of $3 per share thereafter. A 50% retracement, completely in line with spot and swap movements, as analysed here daily at MB.
Again, the takeaway with commodities apart from the overall macro picture is that playing simple breakouts and looking beyond the intraday volatility and watching longer term trends take time to evolve has paid handsomely for the nimble investor. Imagination is key here and holding your nerve!
Stocks
The last section to look at is stock indices. A quick look at the bigger movers and where they stand year to date (YTD) in local currency terms:
- Nikkei 225, up 10% YTD, but from its breakout in May nearly 20%, as it follows USDJPY in footstep
- DAX30, up 2.7% (all of that last night!)
- FTSE100, down 0.5%, grinding slowly up before two large corrections and a counter rally from September on
- ASX200, up 5% (almost half of that today) with a similar techincal picture to the FTSE
- S&P500, up 14% in almost a straight line, but with some epic moves…
I’ll start with the Nikkei225 which for most of the time is a proxy for USDJPY and doesn’t provide the same opportunities (in terms of leverage, liquidity and slippage) to warrant a separate position. An exception can be found when trading very large breakouts as those of us remember in late 2012 to early 2013 when the index jumped nearly 70%!
A similar case in late October recently on a daily breakout from a very violent swing that precipated the machinations of a new round in Abenomics in Japan:
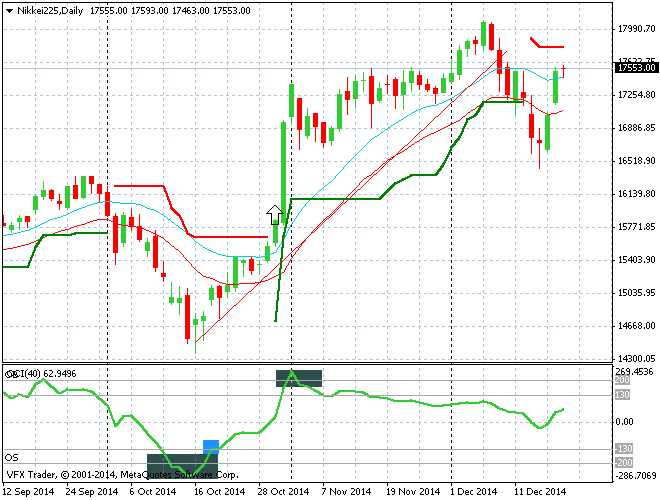
This move with an entry at 15670 points saw the Nikkei move up over 2000 points or 13% in just over a month, proving the case that timing, not just sitting in the market can be very profitable, quickly.
I posted a chart of a straight steel rule as the technical picture for the S&P500 one time on Macro Morning recently that only garnered a few guffaws, but in reality you use it for the entirety of 2013 and most of 2014!
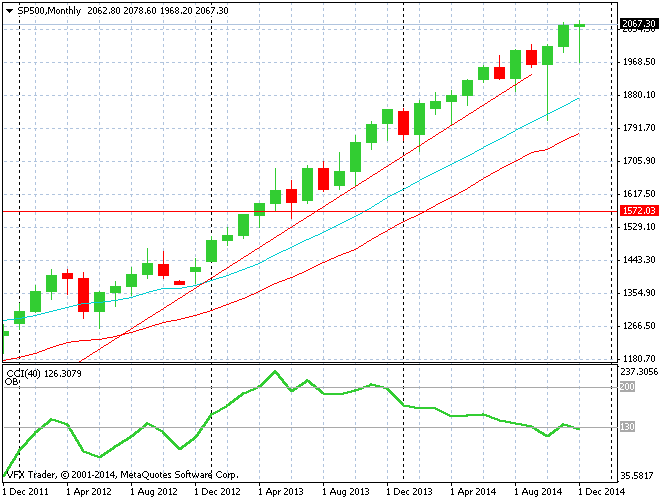
Coming out of this epic bull market, where the pre-GFC highs were soon left behind and forgotten, and “BFTD” became the strategy de jeur, there was only one blip in being long all year and that was heading into the end of QE3 in mid October.
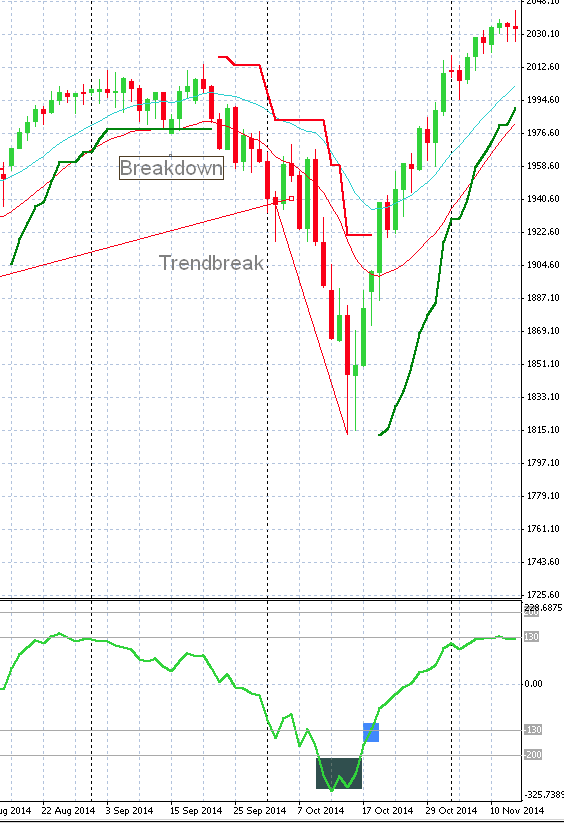
A quite normal dip breaking down daily average volatility soon turned into a rout when the trendline from 2013 was broken significantly. Outside bearish days reinforced the selloff until a grossly oversold situation saw the buyers step in once more and an enormous counter rally – around 12% in little over a month – put the bubble back on track.
Besides that shorter term move, being long on a weekly or monthly basis, buying each dip along the way systematically has proven that buy and hold can work – when it works!
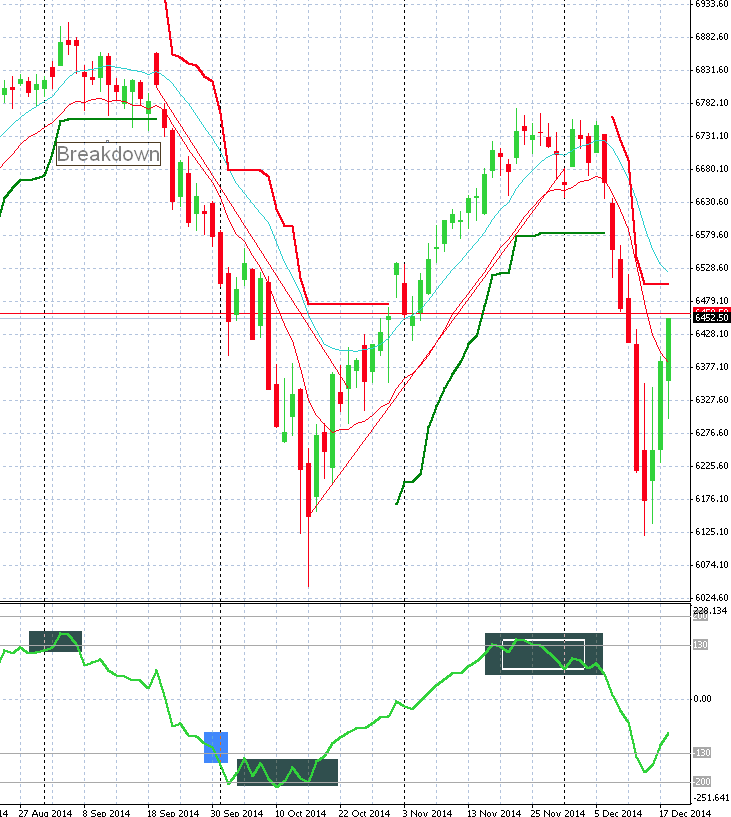
The DAX, FTSE and ASX200 were characterised by two violent corrections in the later half of the year with all moving down over 10% in less than a month before solid rebounds of differing magnitudes. The daily correlation between all three makes it hard to choose which one as the standout, but the FTSE move on the downside was the “best” with an almost identical setup most recently:
Conclusion
It’s been a big year filled with a lot of surprises. The takeaway for me is while its great to have a set of mental models describing the political, macro and other factors going on in markets around the world, price action will always lead the way. Being nimble and ready to change your mind and direction, having a simple entry strategy, a robust risk management system and the psychological willpower to see it all through are the keys to successful investing.
Good luck and see you all in 2015!