
By Philip Soos and Paul D. Egan
Over recent weeks, commentators have repeatedly claimed Australia’s high housing prices are due to a supply shortage. Former Treasurer Peter Costello blamed surging housing prices on a shortage, as did Alan Kohler. Treasurer Joe Hockey has a similar perspective, claiming:
It is just an infinite mantra for international commentators, for analysts based overseas to say ‘well, you know, there’s a bit of a housing bubble emerging in Australia’. That is rather a lazy analysis, because fundamentally we don’t have enough supply to meet demand. That doesn’t suggest there’s a bubble; there might be a price increase of some substance, but you’d expect the market to react and produce some more housing.
For over a decade, the common refrain is a shortage of dwellings has driven up housing prices. It is a mantra repeated endlessly by government, industry and academia. While it is easy for vested interests to claim a shortage exists, the data paints a different story. A good way to examine whether an adequate supply of housing exists is to compare the flow of new dwellings to new net population. Many analyses simply look at the relative or absolute change in dwelling stock, which is pointless without first considering changes in population.
Also, comparing the flow of new dwellings to existing population says little as new supply matters most to the net flow of new people, rather than the majority of the population who are already housed. It is important to note there are factors that are not captured in the ratio that require additional consideration:
- The total population measure is used, although only adults should be considered, for children don’t purchase homes, make mortgage payments or pay rent.
- An increase in the natural population through births doesn’t automatically necessitate new dwellings be built, though it may result in families upgrading to larger dwellings.
- Renovations and extensions of existing dwellings are overlooked, but generate additional housing capacity.
- Many immigrants arrive in groups, requiring only one dwelling per family/shared household.
- Building completions do not take into consideration dwellings that are demolished, condemned or held off the market.
- The slow rise in sole occupant households, divorce and/or childless couples (demographic change) may drive a long-run trend toward lower occupancy rates in general.
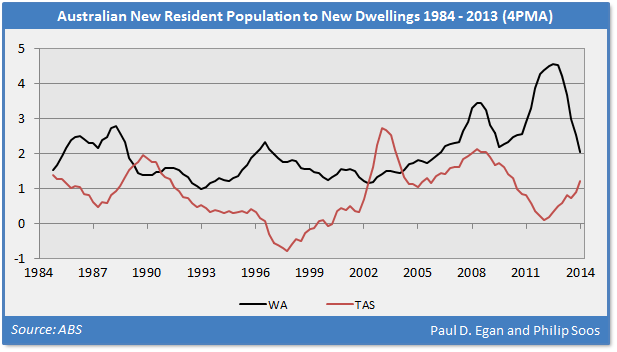
A total housing stock series adjusted for demolitions would be better than using housing completions, but there are no long-term housing stock series available for the states and territories on a quarterly basis. The series for building completions, however, provides a reasonable measure to illustrate general trends. Overall, the factors above probably have the net effect of understating supply. Due to the volatility of these data series, a 4-period moving average (4PMA) trend line is used to clarify the trends.
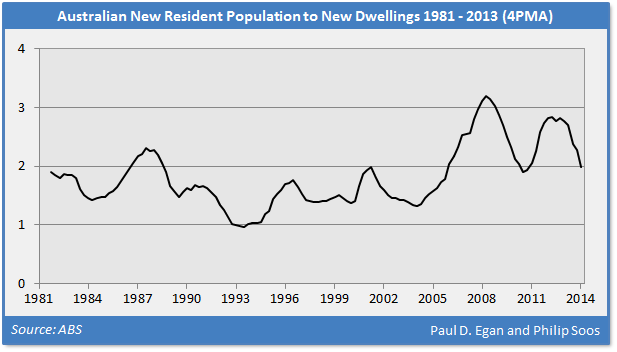
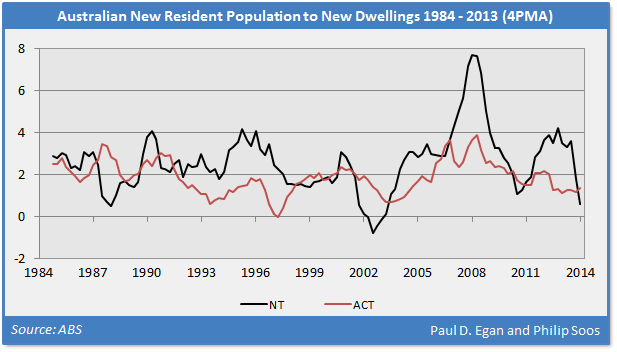
Between 1996, when real housing prices began to boom, and 2006, just before the onset of the GFC, Australia built, on average, one new dwelling for every 1.5 new net persons. The ratio then surged during the GFC as uncertainty, debt deleveraging, fraud and insolvencies swamped property developers, leading to a reduction in the rate of building completions. The rising ratio was boosted by the government’s foolishly high population growth policies via immigration as they sought to lift the weakening economy.
This appeared to create a genuine housing shortage between 2007 and 2010, as both the nominal rent to inflation and rent to income ratios strongly increased, and the ratio of new people per new dwelling exceeded the overall occupancy rate (2.7) for the first time in over four decades.
After 2010, nominal rents tracked the rate of inflation, and are now falling steeply in Perth and Canberra, with Brisbane likely to follow on the end of the mining investment boom. This indicates the GFC-induced shortage has abated, and supply has resumed its trend, even in the face of higher population growth.
It should be noted that most demand for housing comes from buyers, not tenants. Thus, a rise in imputed rents on owner-occupied housing, not actual rents on the investment property stock, signals a shortage in the housing market. Unfortunately, data series of quality-adjusted imputed rents are not available, and would still technically require the ‘user cost of capital’ method to properly assess the trend in imputed rents.
Nevertheless, the long-term residential price to rent ratio, which combines total imputed and actual rents, experienced a steep surge beginning in 1996. Economist Dean Baker, who identified the US bubble back in 2002 and predicted the GFC, noted “No one can produce an explanation as to how fundamental factors can lead to a run-up in home sale prices, but not rents.”
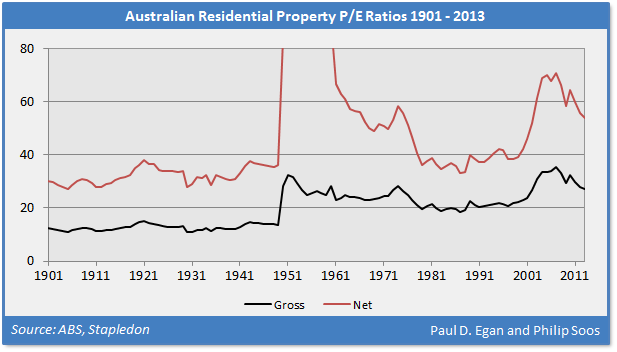
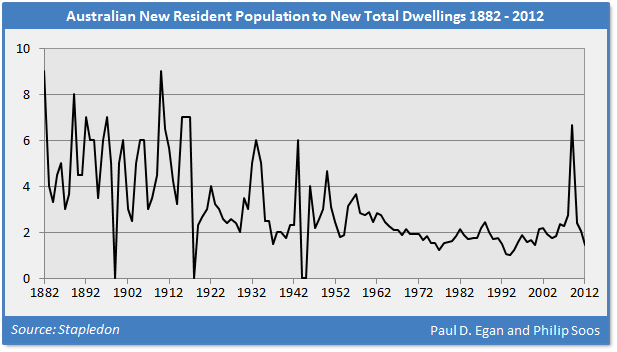
From the trends identified in the graphs, it is clear the supply of housing has been more than sufficient to meet new net population growth. In some years, there has been more than one dwelling built per person, while at other times, there has been a continual growth of housing supply while population growth turned negative. Over the course of the housing price boom beginning in 1996, Australia has built, on average, one new dwelling for every 2.0 new net persons. This is in line with the post-WW2 average of 2.0 between 1946 and 2012.
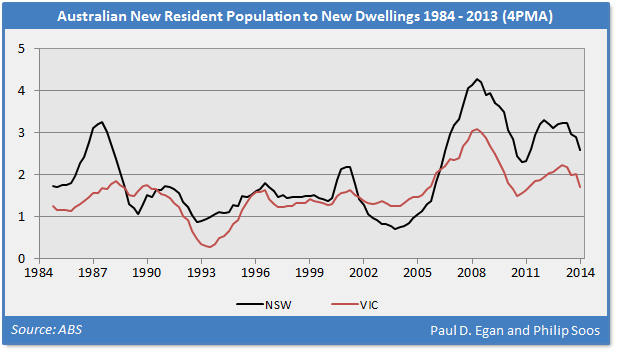
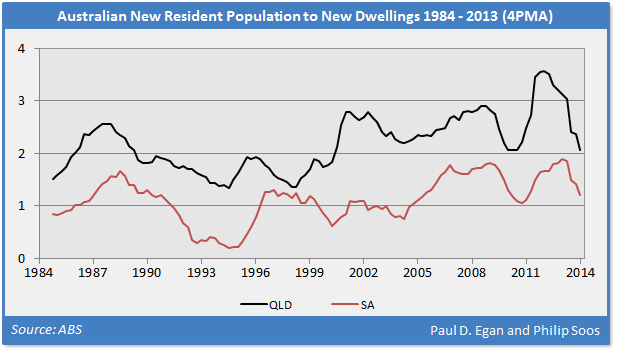
The inadequacy of the housing shortage argument is apparent for the trend in the NSW ratio. Sydney, which dominates the state’s housing market, experienced a massive price boom between 1996 and 2004, yet over this period, one new dwelling was built for every 1.4 new people. At the peak in 2004, the ratio decreased to an insane 0.2 (the trend line removes some of the visible precision in the ratio). In other states and territories, the ratio turned negative, indicating negative population growth in the face of positive dwelling construction, even while prices remained steady or even rising.
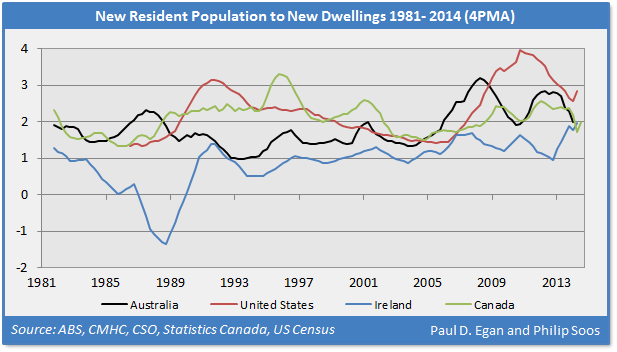
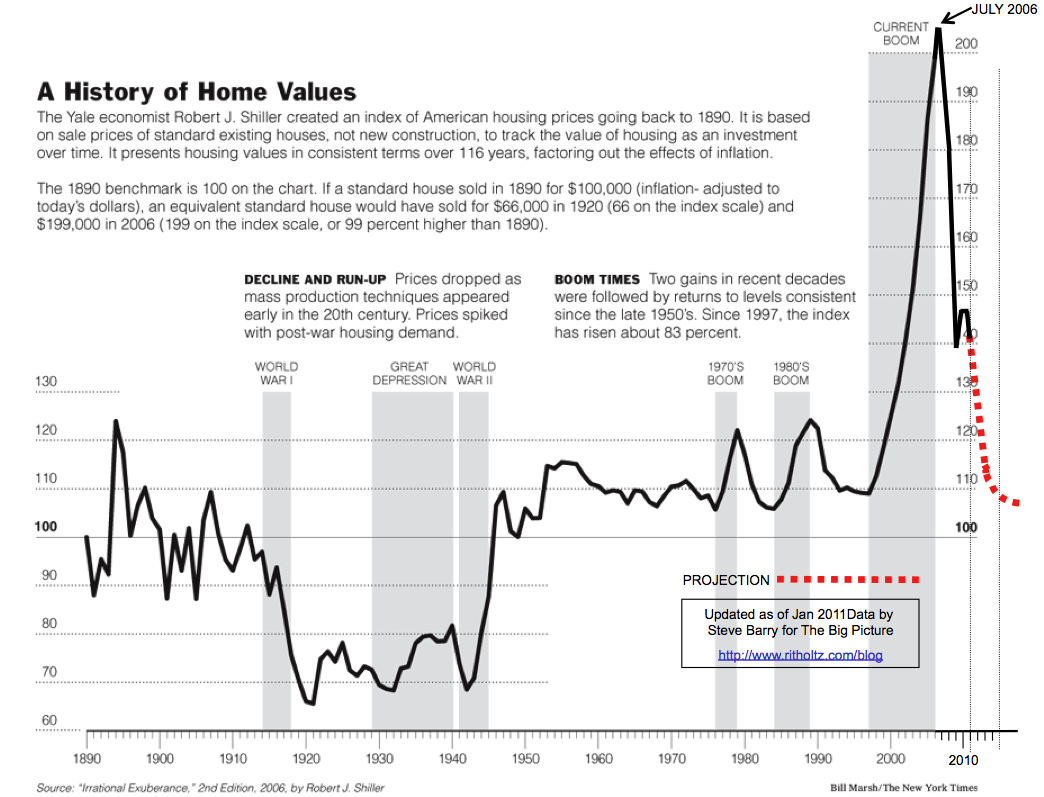
The housing booms in both the US and Ireland was blamed on shortages, but the real cause of high prices were speculative bubbles. The graph below shows that between the mid-1990s (when prices began to rise) and the GFC, Australia’s supply was superior to that of the US, but below that of Ireland. The latter country had an epic building boom, with a ratio of 1.1 between 1995 and 2007, the trough and peak of real housing prices.
Canada probably has the world’s largest current housing bubble, but with a ratio of 2.1 between 1996 and 2014 (similar to Australia’s), it is highly unlikely this country has a housing shortage. Canada’s ratio closely tracked that of the US pre-GFC, and continued post-GFC while the US housing market crumbled.
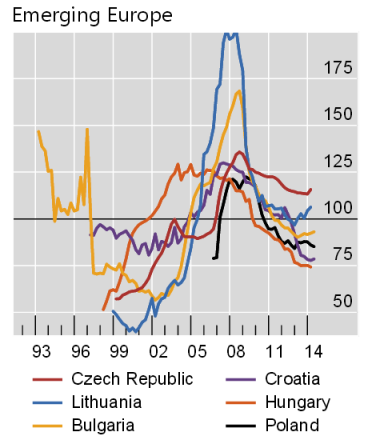
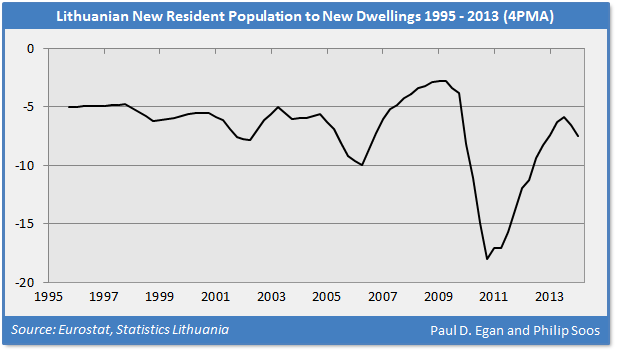
No country better illustrates the utter absurdity of the housing shortage argument than Lithuania. This country experienced an insane housing bubble in recent times, with the real (seasonally adjusted) housing price index increasing from 25 in 2001 to 200 in 2007; a boom of 700 per cent! This is an average annual increase of 117 per cent between 2001 and 2007. The Lithuanian housing bubble dwarfs even the massive Irish bubble, approximately double the size in real terms from trough to peak.
 While data from Statistics Lithuania are clearly not as reliable as the ABS or the statistical offices of other developed nations, it is sufficient enough to show the trends in housing and population during the boom and bust. Its population has been in constant decline since independence (Modern Lithuania).
 Lithuania has a housing stock of around 1.3 million, which hasn’t grown. Unsurprisingly, between 2004 and 2013 (where data are available), the total housing stock declined by 0.2 per cent or by almost 2,000 dwellings. Population fell by 12.6 per cent or a net -427,000 persons over this period. Although both dwellings and population have fallen, this translates into an effective decrease of 214 people per net demolished dwelling!
Even though the housing stock declined slightly, there was a constant flow of building completions of a couple thousand per quarter, likely replacing old dwellings in prime locations. Comparing the ratio of net population change to building completions yields a persistently negative ratio, given the extreme net emigration. In 2007, the Lithuanian population fell by 40,000 while the housing stock increased by 6,000 dwellings – as prices boomed to its peak.
It is clear dwelling shortages were never the cause of the international housing booms, but Australian commentators continue to blithely make this assertion. The most authoritative body on this issue, the (now abolished) National Housing Supply Council (NHSC), made these claims in numerous reports. Their comprehensive analysis is well worth reading, given the wide-ranging study of Australia’s residential property market.
Unfortunately, the NHSC analysis is identical to those authored in the United States, during the build-up to its largest housing bubble on record. The conflicted NHSC produced questionable analysis to arrive at a preconceived conclusion. As one of the authors previously stated:
Take the US as a case study. Leading institutions such as the Federal Reserve, National Association of Realtors, California Building Industry Association and Harvard University’s Joint Center for Housing Studies produced sophisticated studies to show that the $8 trillion housing boom was caused, in part, by dwelling shortages. These studies were authored by professors, PhDs, and businesspeople, all with extensive knowledge and experience but with conflicts of interest that could fill a small book. Yet, their expertise was as illusory as the shortage when the housing market crashed. The same again occurred in Ireland and Spain to the point where these three countries are now bulldozing entire neighborhoods to reduce some of the massive oversupply.
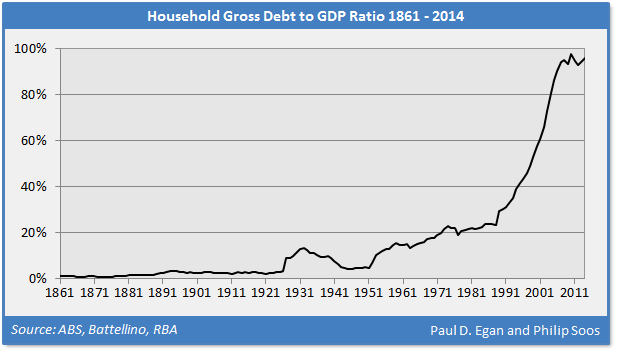
The housing shortage argument is also used to claim Australia needs more investment into the residential property market, whether domestic or foreign, to increase supply. Strangely, the housing market functioned relatively well during the 1960s, 1970s and 1980s with a household debt to GDP ratio of around 10 to 20 per cent and a low proportion of property investors relative to owner-occupiers.
The ratio has risen close to 100 per cent in recent years, the result of debt-financed speculation – a primary cause of bubble-inflated prices. More of the same is not the solution, but this helps explain why the government refuses to take action to constrain accelerating debt. Despite the certain hardship and risk in allowing the trend to continue, the contribution to short-term GDP growth provides the illusion of prosperity and competent economic management.
The RBA refuses to implement macroprudential regulations, the FIRB is unwilling to enforce foreign investment rules, APRA allows the Big Four banks to use generous, opaque and manipulated internal ratings based models to determine wafer-thin capital buffers, ASIC declines to investigate serious allegations of subprime fraud, unfettered self-managed super fund property investment is booming, and government will not consider reregulation of the banking and financial sector or reduce leverage-inducing tax expenditures.
As noted in our forensic investigation of the banking and real estate markets – Bubble Economics: Australian Land Speculation 1830-2013 – the Australian economics profession has never managed to identify any growing asset bubble or predict the subsequent economic fallout. There is no evidence economists warned about or even noticed the real estate bubbles in the 1830s, 1880s, 1920s, mid-1970s and the late 1980s, or the stock market bubbles of the 1920s, 1987 and the Dot-Com.
Not only does the mainstream economics profession have a 100 per cent failure rate in forecasting, but economists across the board expend significant effort into denying bubbles exist, as was the case with the Dot-Com bubble, and the numerous housing bubbles in international jurisdictions. If elite Harvard/MIT/Chicago economists not only missed the largest housing bubble in US history, but also denied there was one, what hope do Australian economists have?
As history patently reveals, the answer is ‘exactly none’. Ignorance and/or denial are standard fare, and we should not expect anything different. Treasurer Hockey may wish to review his position, for the easy and lazy analytical path is actually being trodden by those economists and policymakers claiming that high housing prices are caused by a mythical shortage.
Confronting the real causes would require our compromised legislature to proactively respond, instead of rigging government and market outcomes to benefit the growing power, profit and authority of the horde of private monopolists, usurers, speculators, rent seekers, free riders, financial robber barons, control frauds, inheritors and the indolent rich.
Hockey’s comments should come as no surprise, for he owns a home and four investment properties, and is involved in a family real estate agency. His home in Canberra, purchased for a bargain basement price of $320,000 in 1997, is now worth an estimated $1.5 million, having increased in price by 369 per cent in nominal terms.
There is an obvious incentive to oppose any analysis and/or policy that could potentially reduce the mountain of unearned wealth and income flowing from surging land prices (economic rents). The conservatively estimated $300 million in real estate owned by the federal politburo means this bias is widely shared by all in parliament.
In conclusion, there is no housing shortage as is commonly claimed, though a temporary shortage did emerge during the GFC. Australia is a mirror image of other countries where high housing prices were also blamed on a shortage, always revealed, in hindsight, to be a chimera.