
It’s no ordinary day for the update. Indeed, it is the update’s apotheosis, the day of reckoning it was designed to track for a nation that has no idea about the bet it has made.
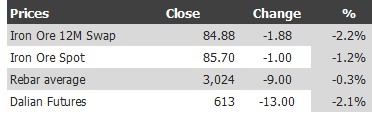
Today we’ve taken out the post-2009 iron ore price low with a resounding “crack” in the floor of the global steel edifice and so I’ve prepared a few extra charts to celebrate the occasion and attempt to offer a sense of the magnitude of what is transpiring. First, the price table for September 2, 2014:
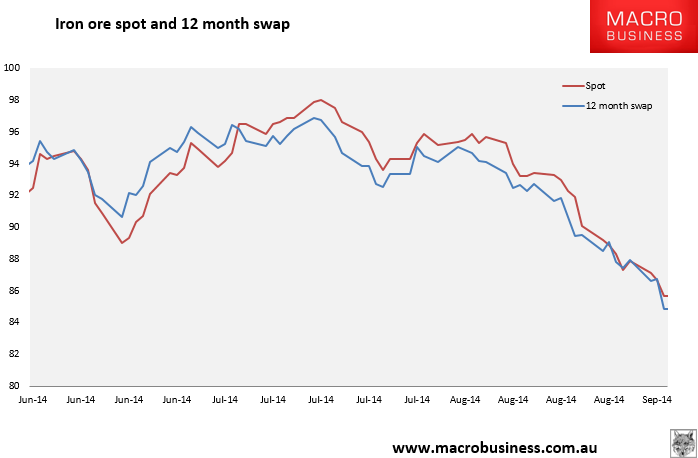
Next, the daily price chart, which again shows no useful contango and no turning signal:
And for history’s sake, the long term price chart, which has formed the largest and most terrifying bearish descending triangle I can remember in any market:
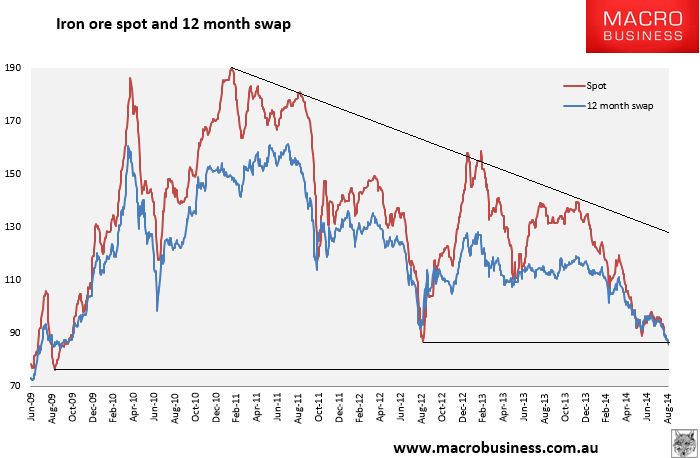
Next support is at, wait for it, $76.10…
Dalian iron ore futures have busted lower again:
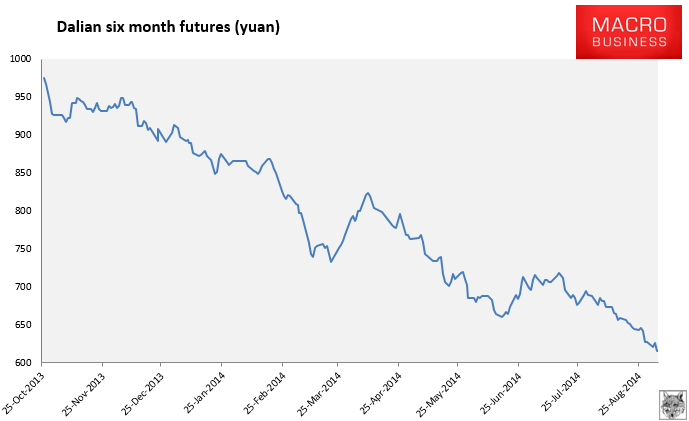
Converting this to $US is more art than science but we need to subtract 17% tax plus port and other charges to reach the actual price. It’s signaling roughly $US80 by my calculations but I wouldn’t take that to the bank.
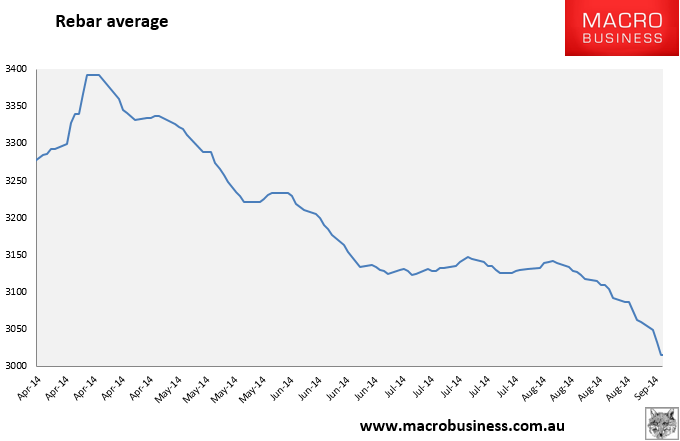
Rebar futures continue their collapse as well, smashed down to the mid 2850s. Physical steel prices are now chasing hard:
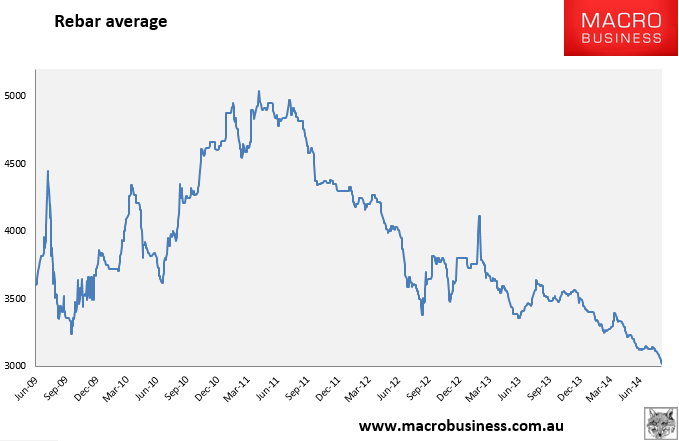
And for more historical perspective, another ten year low:
So, what to make of it all? There are two large forces coming to bear on steel and iron ore. The first is demand sucks. In absolute terms it’s decent, with steel output still marginally above last year. But in terms of the what both the Chinese steel manufacturers expected and built capacity for, and the global iron miners expected and built capacity for, it is miles short. Both reckoned that demand would rise uninhibited to roughly 1 billion tonnes per annum in 2020. Instead it’s flattening out at around 800 million tonnes today.
Massive steel over-capacity is therefore killing the steel price. I have no idea where it will settle but we’re not there yet. Before it can find a floor a number of things must happen. The most important is Chinese steel mills must go out of business and that has barely even started. The second is that the iron ore price must also find a floor but for that we still face epic overcapacity there too.
And that’s the second great force at work. Iron ore supply has come on at exactly the wrong moment and will keep doing so for two more years at astonishing rates. Some 200-300 million tonnes of capacity will be displaced in the next three years, in Australia, in China, in Brazil, in Africa and everywhere else that digs up the red dirt.
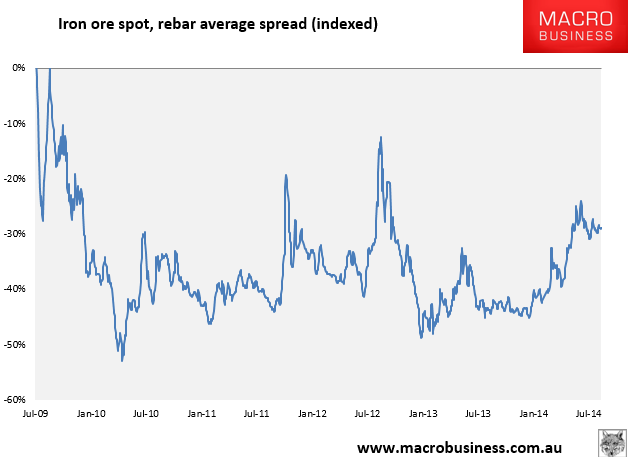
While that transpires, steel mills can shove their own deflation back up the supply chain to preserve their margins, which is exactly what they are doing:
Thus the entire steel and iron ore price deck can and will keep shunting lower until enough capacity is shaken out in both sectors.
The China building boom was historically unprecedented in scope and swiftness. The supply response was equally so. The bust will be of the same magnitude.
These posts are usually locked for members. Today is a special treat so if you wish to follow this historic story of boom and bust for the next few years, take out a subscription! I recommend it for the financial health of everyone with an interest in Australia.
