

In last year’s members report on the Perth housing market, we noted that storm clouds were gathering on the horizon for the Western Australian economy, thanks to the unwinding of the biggest mining and commodity price boom in the state’s history. This, we argued, would take up to 18 months to manifest, which would presumably see Perth housing hit the wall sometime from 2015.
This report revisits the Perth housing market and finds that the canary in the mine is dead, and represents a risky proposition for both housing investors and first home buyers alike.
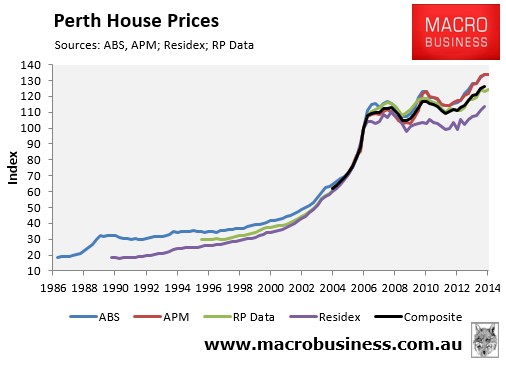
The evolution of Perth house prices:
The next chart tracks detached house and unit prices in Perth, as reported by the four main housing data providers: the Australian Bureau of Statistics (ABS); Australian Property Monitors (APM); RP Data-Rismark; and Residex, as well as a composite measure, which is the average of these indices. The ABS has the longest running house price series for Perth, going back to 1986, whereas APM’s is relatively new.
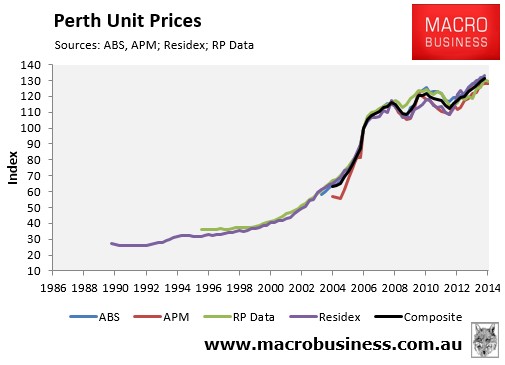
For units, Residex has the oldest series, which dates back to 1990 only.
Unlike the major east coast capitals, where all four house price series tend to track each other closely over time, there are significant divergences in Perth, with the ABS providing the most positive results and Residex the most negative. Nevertheless, when averaged-out across the four data providers, Perth house values are at an all-time high in nominal terms (see next chart).
There is less volatility in unit pricing, with all four series tracking each other fairly closely. Again, however, unit prices are at an all-time high in nominal terms (see next chart).
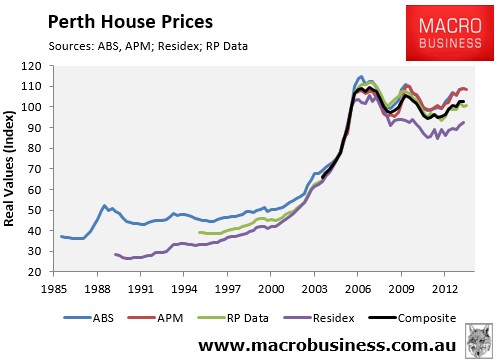
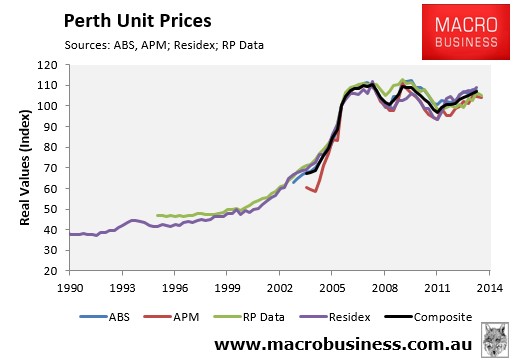
When adjusted for inflation, Perth dwelling prices were still 6.2% (houses) and 3.5% (apartments) below their 2007-08 peak as at March 2014, when averaged-out across the four data providers; although prices have clearly recovered much of their losses (see below charts).
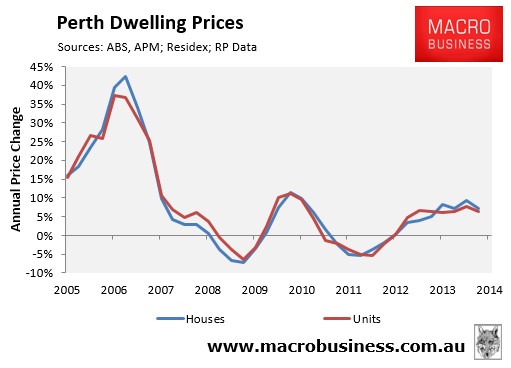
Price momentum slowing
The most recent annual results showed that the Perth housing market grew at a solid clip, although price growth was slowing. As at March 2014, annual price growth had slowed to 7.1% (houses) and 6.3% (units) when averaged-out across the four data providers (see next chart).
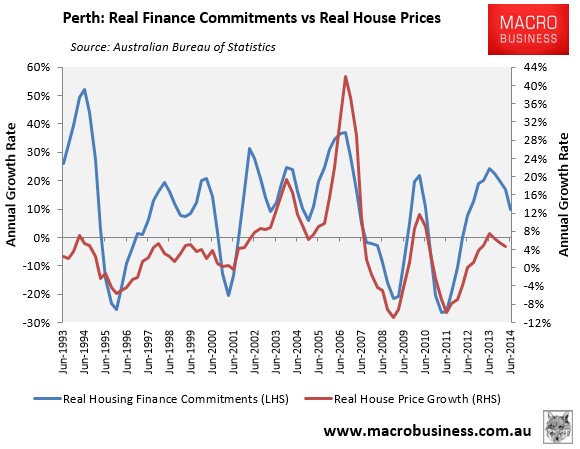
More importantly, the single best short-term indicator for house prices – housing finance commitments – continues to slow which, given past strong correlations, suggests that Perth house price growth will continue to moderate throughout the remainder of this year and into next (see next chart).
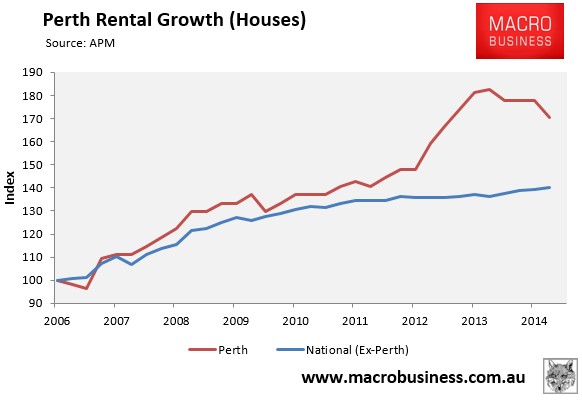
Rental market also slowing, fast
Perth’s rental market also adds weight to the view that its housing market is losing momentum.
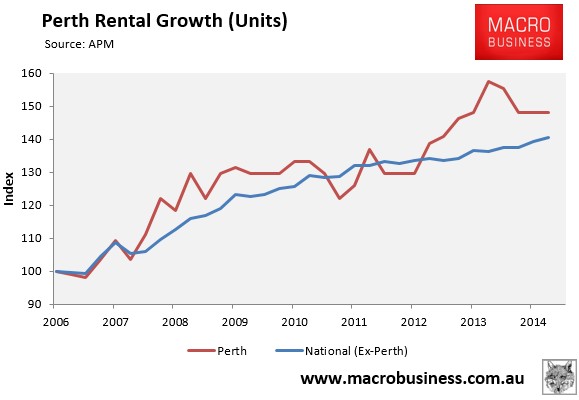
After exhibiting exceptionally strong rental growth in the 15 months to June 2013, Perth rents have fallen by 7% (houses) and 6% (units) respectively over the past year (see below charts).
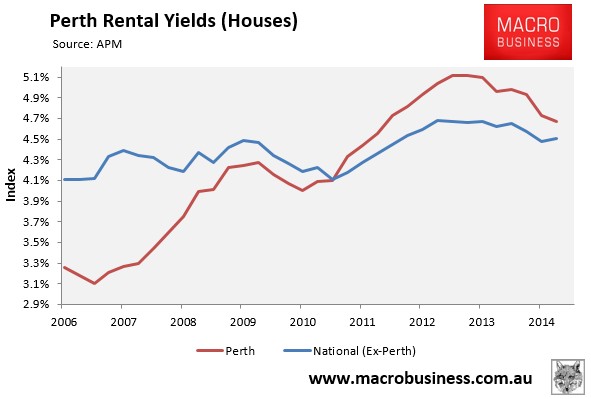
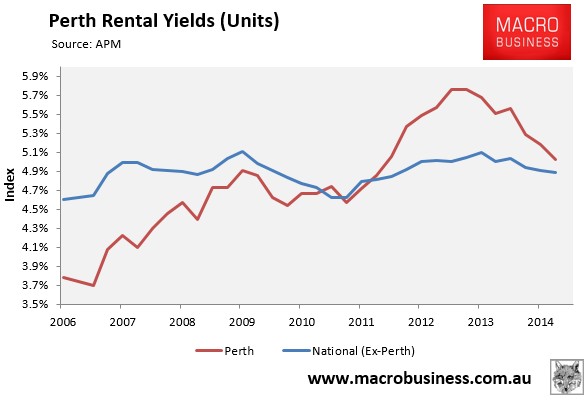
Perth rental yields, which were 4.7% (houses) and 5.0% (units) as at June 2014, are also falling fast, although they remain above the national capital city average (see below charts).
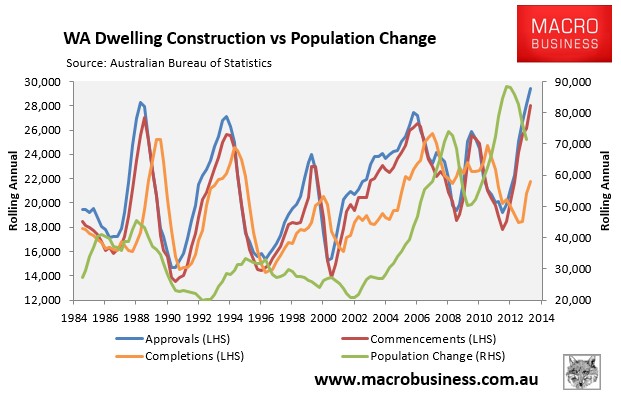
The previous strong growth in Perth house prices and rents had been driven, in part, by strong population growth, which had not been matched by increased housing construction. This situation is changing, however, with population growth moderating just as supply starts to play catch-up (see next chart).
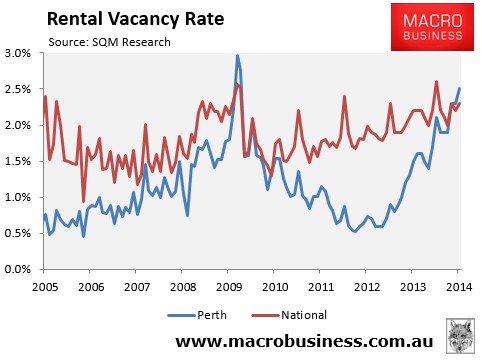
Reflecting these dynamics, Perth rental vacancy rates are also rising fast and have recently climbed above the national average, suggesting further weak rental growth ahead (see next chart).
Storm clouds continue to gather for the economy
Perth’s economy and employment market has, for a long-time, been the strongest in the nation due to the once-in-a-century boom in commodity prices and mining-related capital investment.
Times are changing, however, with the ongoing unwind of both commodity prices (iron ore in particular) and mining investment threatening to cut Western Australia’s growth rate, reduce incomes and increase unemployment.
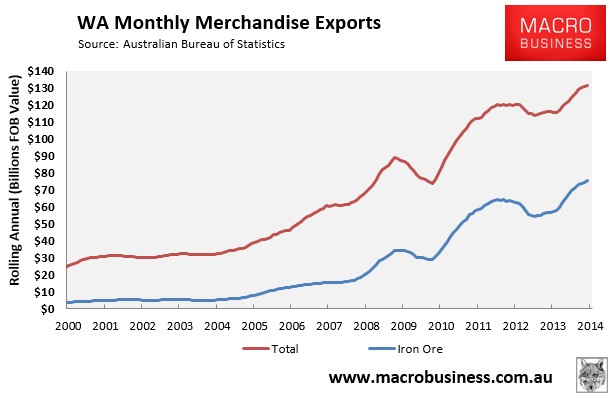
Iron ore is, by far, Western Australia’s key export commodity and a key driver of the state’s good fortune. Iron ore currently accounts for nearly 60% of Western Australian merchandise exports, up massively from only 16% of total exports in 2000 (see next chart).
The strong growth in iron ore and gas prices drove a huge surge in mining and energy-related capital expenditures (capex), which hit a peak of 30% of Western Australian state final demand in June 2012, up from only around 7% a decade earlier (see next chart).
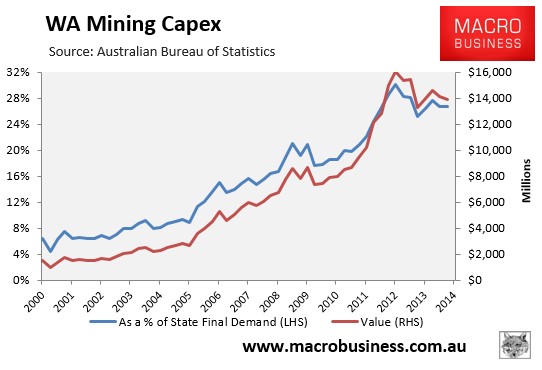
As shown by the above chart, mining and energy-related capex has only fallen moderately from its peak and has much further to fall. Iron ore capex has retraced some way already, supported by the the late arrival of the $10 billion Roy Hill project, which will begin to ship by late 2015. The energy spending spike was even larger, with two major gas projects in Gorgon and Wheatstone accounting for an astonishing $80 billion spend over six years from 2010. Gorgon is now 85% complete and will begin to ship in mid 2015. Wheatstone is about 40% complete and will ship from mid 2016. These three projects alone constitute approximately 20,000 jobs that will be reduced by 90% as construction moves to production.
From engineering to construction and ancillary mining services, tens-of-thousands of Western Australian jobs are now under threat as mining projects currently in the pipeline are completed.
Moreover, with iron ore prices falling sharply and Australian LNG uncompetitive versus the US’s shale gas boom, there will be increasing pressure on mining and energy firms to slash operational expenditure for years to come, which will further weigh on jobs and income growth in Perth. It also means that the likely retracement of the mining capex boom is a fall by 2017 to levels similar to those in the period 2000-2002.
The Western Australian Government is also set to come under increasing pressure, with the state facing falling revenues as lower iron ore prices reduce mining royalties.
The State Budget, released in June, was positively heroic in its iron ore forecasts, tipping an average spot price of $122.70 over 2014-15, and only minor downward adjustments in the out years (see here). Mining royalties made up 21% of Western Australian revenue in 2013-14, which is forecast in the Budget to increase to 24% by 2017-18, with iron ore accounting for about 90% of total royalty income across the forecast period.
According to the sensitivity analysis contained in the Budget Papers, every $US1 fall in the iron ore price reduces Budget revenues by some $49 million. So with prices down by around $US30 since then, the Western Australian Budget could face a hit to revenues of around $1,470 million in 2014-15, if iron ore prices remain at current low levels (let alone fall further).
While Western Australia would likely claw back much of this lost revenue via the GST distribution between the states, there would likely be a considerable lag. Any revenue shortfall, therefore, increases the risk that the State Government will make cuts to public sector services and jobs, as well as raise taxes, in a bid to shore-up the state’s finances. The Government has already confirmed as much. This could exacerbate any downturn, as well as dent consumer and business confidence further.
Already, slowing mining investment appears to be having a detrimental impact on some key macroeconomic indicators in Western Australia.
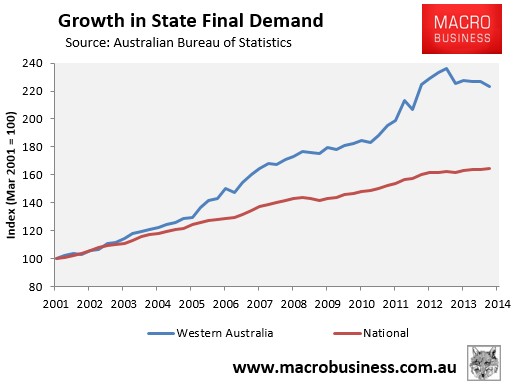
Western Australian state final demand (SFD) – the broadest measure of domestic economic activity – had for much of the past decade exceeded the other mainland states. However, after peaking in December 2012, SFD has fallen by 5.5%, suggesting that domestic economy may already be in recession (see next chart).
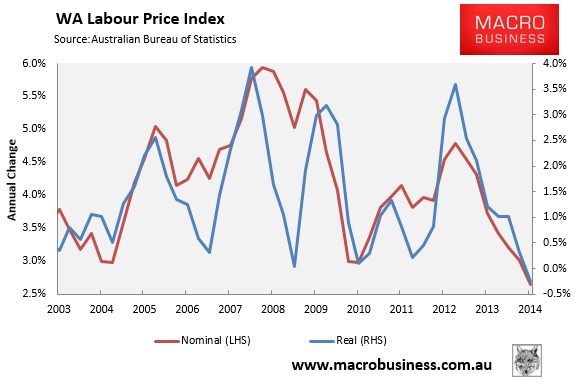
Wages growth in Western Australia has also slumped to the lowest level in more than a decade, growing by only 2.6% in the 12 months to March 2014 and falling in real (inflation-adjusted) terms (see next chart).
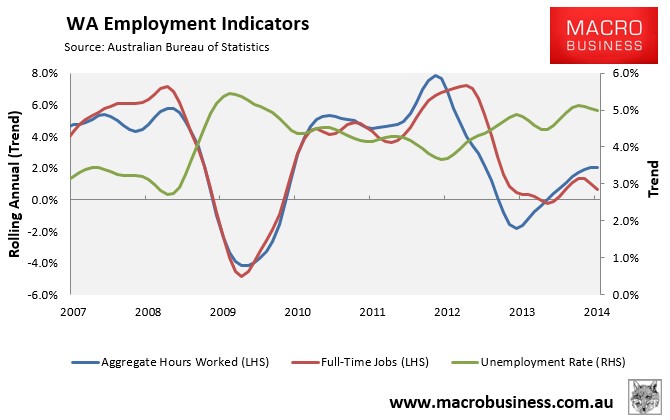
Surprisingly, the labour market has to date held up well. Despite anaemic growth in full-time jobs, aggregate hours worked has bounced back strongly over the past year and unemployment has recently begun trending lower (see next chart).
However, with the unwind of the epic commodity price and mining investment booms likely to be enduring, and few if any alternative growth drivers emerging, risks for the Western Australian economy are skewed overwhelmingly to the downside, with domestic activity, employment and incomes all likely to take significant hits over coming years.
A brief history lesson
As noted in last year’s report, an examination of the smaller mid-1970s iron ore price boom is instructive to determine the potential impact on the Perth housing market as the commodity price and mining investment booms unwind.
Shortly after Australia’s terms-of-trade peaked in 1974, Perth house prices increased to over 100% of the national average, before declining in a relative sense over the following decade as iron ore prices, and Australia’s terms-of-trade, collapsed (see next chart).
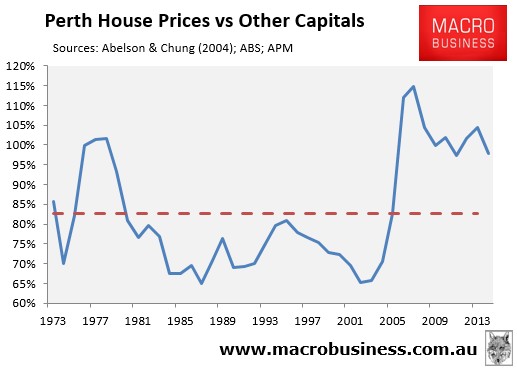
The mining price boom this time around is much bigger than that of the mid-1970s, and Perth’s house prices are currently sitting just under 100% of the national average, having peaked at 115% in 2007. History suggests that as the unwind of the mining investment and commodity booms gathers pace, Perth house values could once again come under significant pressure, falling in both relative and absolute terms.
Bottom line
Risks continue to build for the Western Australian economy, with both commodity prices and mining investment on the decline, which is likely to lead to rising unemployment and falling income growth. The Western Australian Government also faces the prospect of a deteriorating budgetary position, as lower iron ore prices reduce mining royalties, which could potentially be met with cuts to public services and jobs.
While the timing of a possible downturn in Perth’s housing market is still unknown, we are already seeing signs of slowing in the form of falling housing finance growth, which portends a deceleration of house prices throughout the remainder of 2014 and into 2015. Perth’s rental market has also experienced a change in fortunes, with rents falling and vacancies rising sharply over the past year.
Following the end of the mid-1970s mining boom, Perth house prices declined by nearly 30% in inflation-adjusted terms over an eight year period. If history is any guide, similar falls could be in the offing over coming years as Western Australia’s once-in-a-century mining boom unwinds.
With these considerations in mind, investors and first home buyers should think long and hard before gearing-up to purchase Perth property.
