
Today’s March quarter GDP result, which will be released by the ABS at 11.30, is expected to be solid. An AAP survey of 15 economists tips that headline growth will clock in at 0.8% for the quarter and by 3.1% on an annual basis, which is around trend. Some see even higher.
No doubt, various economists and commentators will be championing the result as yet more evidence of the economy’s strong foundations, and some will use it to decry us “doomsayers” who are genuinely concerned about the nation’s prospects in the decade(s) ahead. Export-led growth is, in principle, very welcome.
But, I do not consider GDP a particularly useful tool to gauge the economy’s underlying strength or the wellbeing of the Australian people, and believe that today’s “solid” result should be heavily discounted by all and sundry.
A key reason for this skepticism is that although today’s print will be driven predominantly by a large pick-up in net exports, the headline GDP result that will be reported is only concerned with the volumes of goods and services produced and completely ignores prices. Yet, the growing export volumes have occurred (and will continue to occur) in concert with falling export prices, which means that actual national income – a far more important measure of welfare – will have risen far more slowly than the growth in GDP.
The below stylised example of iron ore exports highlights the point more clearly, and shows that even if volumes rise by the same amount that prices fall, the end result for Australia is still much worse:
- assumed an average cost of production of $60 per tonne
- 2013 average iron ore price price: $130 per tonne
- 2013 volume (example only) 500 million tonnes
- Total profits: $35 billion
Assume in 2014:
- export volumes grow 20% to 600 million tonnes
- average iron ore price falls 20% to $104 per tonne
- Average cost of production still $60 per tonne
- Total profits = $26.4 billion
So despite volume growth fully offsetting price falls, profits from iron ore exports actually fall by $8.6 billion (24.5%), other things equal.
Again, real GDP, which only measures volumes, would record big gains under the above scenario, whereas national disposable income – the more important metric – would record a fall.
Put simply, higher volumes are no substitute for high prices, yet headline (real) GDP is only concerned with the former and completely ignores the latter. It is also why we at MB see the period ahead as much more difficult than headline numbers, and most mainstream economists and commentators, will tell you.
If there is one chart that I want you to etch into your consciousness, it the below plotting real per capita GDP against real per capita national disposable income (NDI):
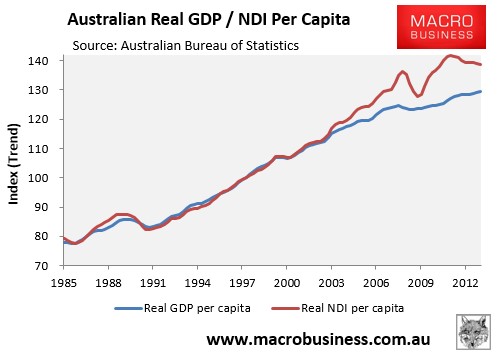
It shows two important things. The first is that real GDP per capita has grown at an anaemic pace since the Global Financial Crisis. Essentially, while Australia’s headline GDP growth has been reasonable over this period, due to the big increase in immigration, everyone’s share of the economic pie has barely grown. Of course, most economists and commentators will ignore per capita GDP and will instead focus on the headline result.
Second, and most importantly, after a decade where per capita NDI grew much faster than GDP – 21% (NDI) versus 14% (GDP) since September 2003 – on the back of rising commodity prices, NDI is now falling, for the reasons outlined in the above example.
Over the next decade or so, as commodity prices and the terms-of-trade continue to trend lower, the red line above (NDI) will continue to converge back to the blue line (GDP), making it a painful period ahead for the Australian economy, even with “solid” GDP growth.
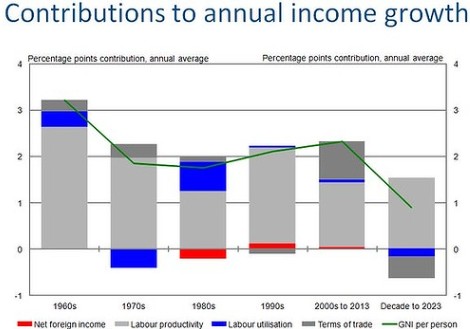
Indeed, the falling terms-of-trade is the main reason why the Australian Treasury has forecast the slowest income gains in the decade ahead in at least 50 years:
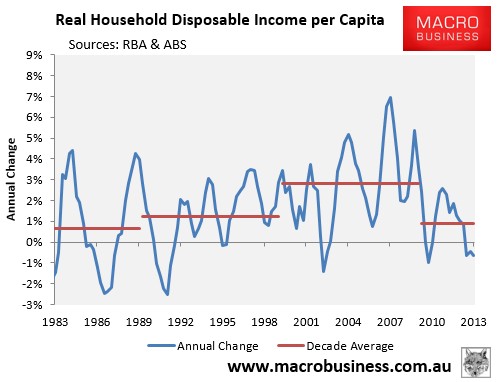
It is also why per capita household disposable income growth has slowed to just 0.9% per annum so far this decade (and is falling), compared with an average of 2.8% per annum growth over the 2000s:
Finally, the rising export volumes, while great for headline GDP, will do little to improve Australia’s employment situation, whereby unemployment is hovering around decade highs; albeit showing signs of improvement (see next chart).
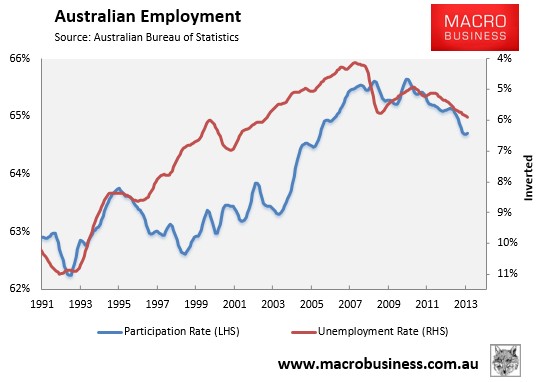
In fact, as the commodity boom shifts from the investment phase to the production phase, Australia is facing significant job losses, since building mines, processing plants and mining-related infrastructure is far more labour intensive than actual resource extraction.
Think about these issues when a commentator tells you that the Australian economy is once again firing on the back of today’s GDP release.
