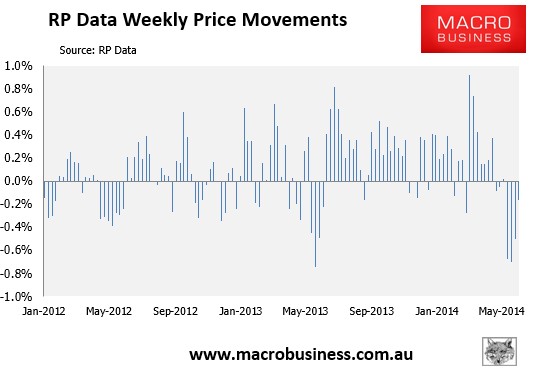
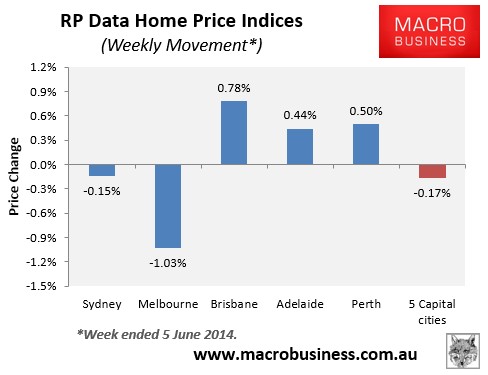
In the week ended 5 June 2014, the RP Data-Rismark 5-city daily dwelling price index, which covers the five major capital city markets, fell by 0.17%. It was the fourth consecutive week of falls (see next chart).
Values fell in Sydney and Melbourne, but rose in the other major capitals (see next chart).
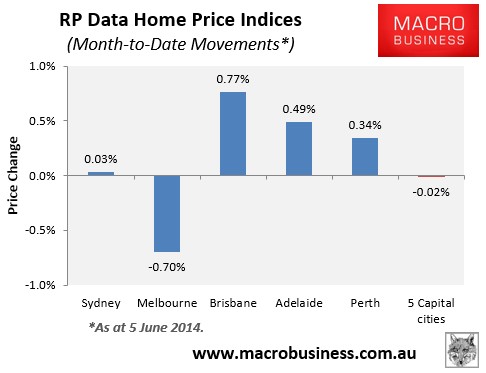
While it is obviously early days, values are basically flat so far in June, with the big fall in Melbourne more or less offset by rises in the other major capitals (see next chart).
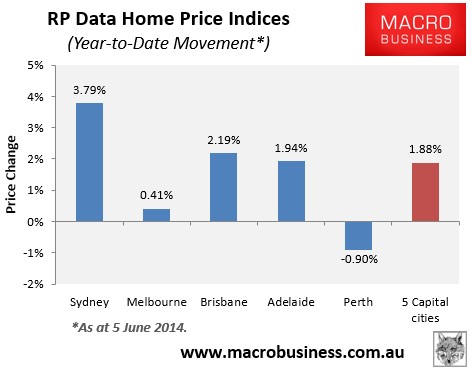
Values are now up by 1.88% so far in 2014, driven by solid gains in Sydney, Brisbane and Adelaide, with Perth values under water:
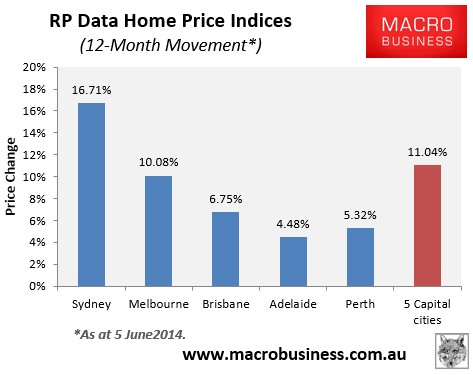
Over the past 12 months, home values have risen by 11.04% at the 5-city level, led by Sydney and Melbourne (see next chart).
The next chart plots the daily movements on a 14-day moving average, in order to smooth volatility. As you can see, the uptrend has stalled, with weakness evident across all major markets (see next chart).
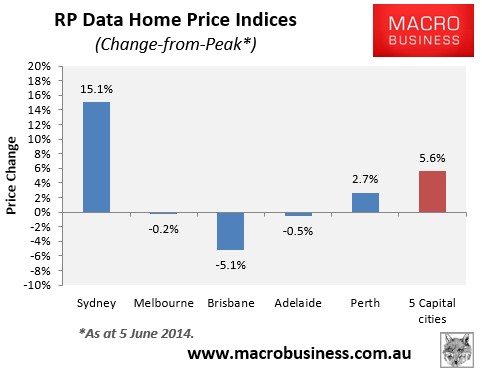
Values are up 5.6% since the 2010 peak at the 5-city level, driven primarily by strong gains in Sydney, with Perth values also up, but Melbourne, Brisbane and Adelaide in negative territory (see next chart).
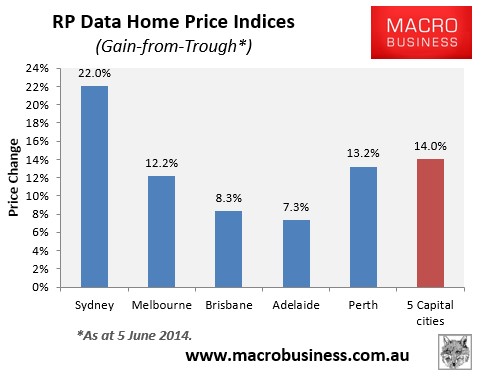
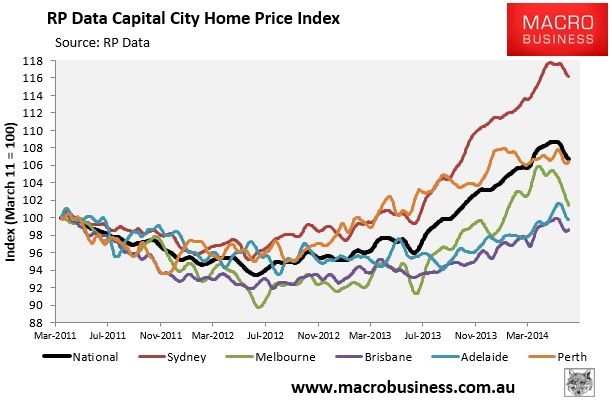
However, major capital home values have now gained 14.0% since bottoming nationally in May 2012, with all capitals rebounding from their respective troughs (see next chart).