Paul D Egan and Philip Soos have published an epic 800-page report entitled Bubble Economics: Australian Land Speculation 1830-2013, which provides a comprehensive examination of the Australian land/housing market, drawing on over 150 years of available data.
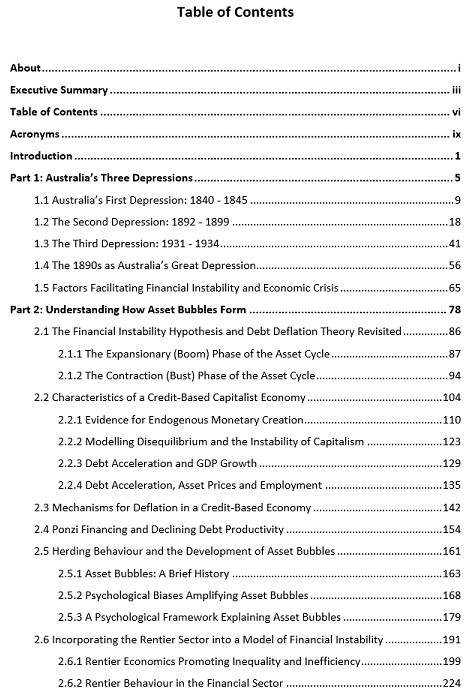
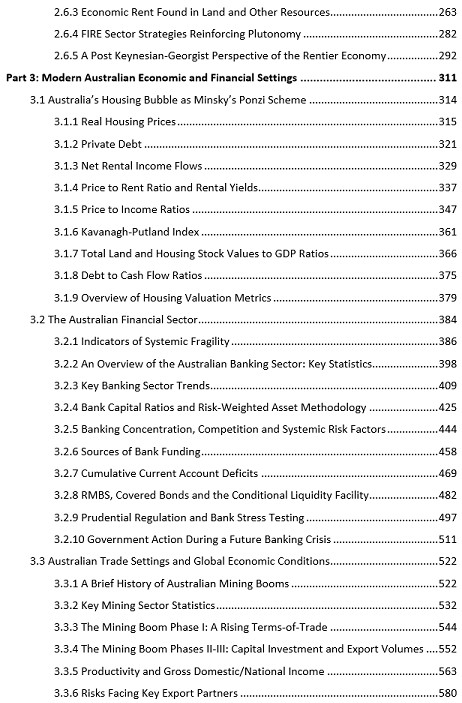
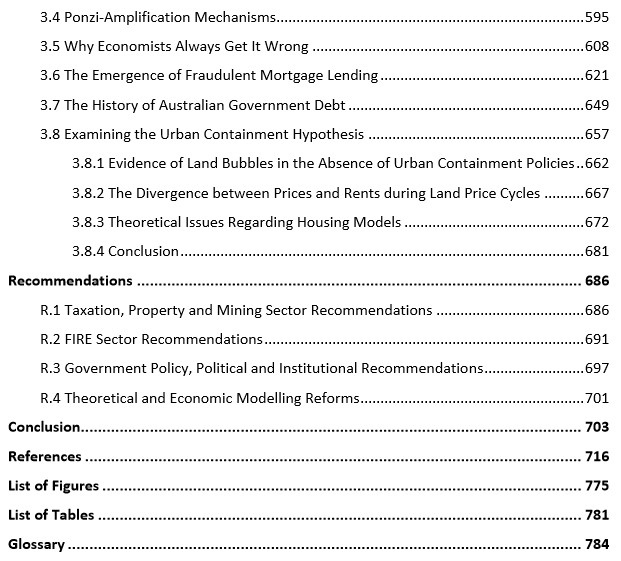
The table of contents is listed below, providing a snapshot of the types of topics covered.
Advertisement
Due to its length and time constraints, I have only read section 3.1, which deals with an array of Australian housing market valuation metrics and includes a plethora of long-term charts illustrating the level of overvaluation currently.
Advertisement
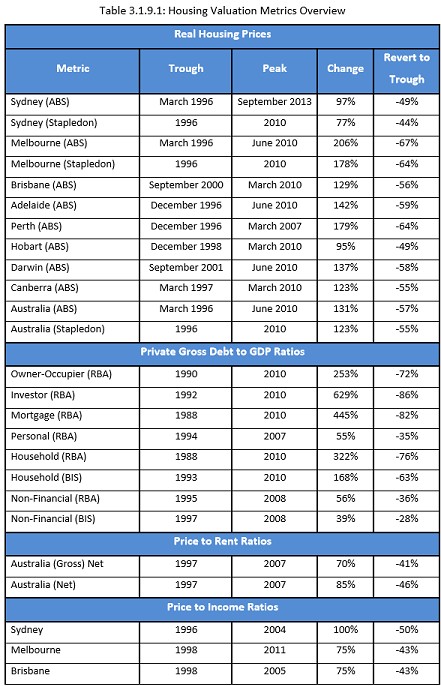
Below is the Overview section (3.1.9), which provides a taste of the types of topics covered in the study:
One of the primary stumbling blocks of property analysis is the failure to distinctly define an asset bubble, so debate on the matter is kept necessarily vague. If specific criteria are not carefully delineated, then no one can say with certainty if a bubble exists or not. This plays nicely into the hands of those making a living from the manipulation of asset prices, including neoclassical economists who like to think the neoliberal program of deregulation, liberalisation and privatisation of the financial sector has resulted in a more efficient market economy where asset bubbles do not form. To this day, housing bubbles are still poorly defined, if at all, on the basis of ‘irrational exuberance’ or ‘chasing capital gain’. The definition articulated by Hyman Minsky decades ago, it would seem, has been routinely ignored. Since 2001, all three conditions of Minsky’s bubble definition have been explicitly met: an increase in real housing prices, a rising mortgage debt to GDP ratio and net rental income losses.
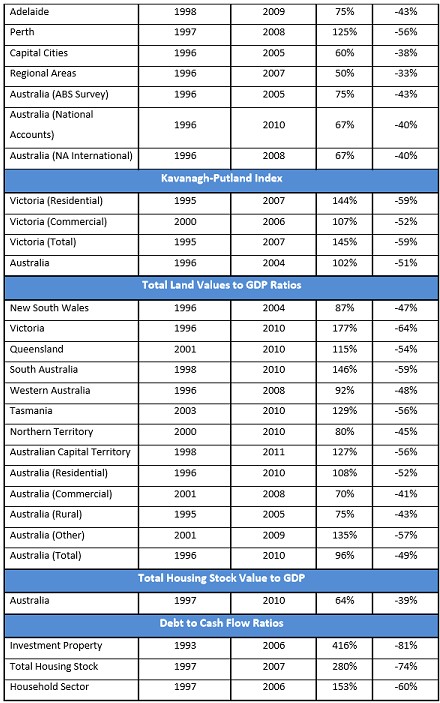
For the handful of economists who publicly identified asset bubbles and predicted the subsequent economic downturns in recent years, only a couple of housing-related metrics were needed to identify a bubble. Those metrics are now considered commonplace when investigating the housing market: nominal price to inflation, price to income and price to rent.671 The analysis in this section of the book provides an additional array of metrics and data to identify bubbles in the residential land market: mortgage debt to GDP ratio, net rental income flows, Kavanagh-Putland Index, total land values to GDP ratio, housing stock value to GDP ratio and the housing debt to cash flow ratio. Rarely have so many metrics been brought together in one place to overwhelmingly prove the existence of a land market bubble. The following tables list each housing valuation metric, noting the rise from trough to peak and the percentage fall required for a reversion to trough in housing prices. These estimates are a general guide only and not precise predictions, for the future is inherently unknowable.
It is unrealistic to expect real housing prices in the capital cities to fall back to indicated trough levels following the strong increase in real rents between 2007 and 2010. The rise in rents, however, is not large enough to offset the surge in housing prices, causing a marked elevation in the price to rent ratio. Despite the resurgence of housing construction since 2010, rents are likely to continue tracking inflation or fall in real terms, compounded by weakening household income growth as the ToT falls and mining capex wanes. Australian economic history and recent international events illustrate collapsing housing bubbles can quickly increase the number of unsold properties (stale stock), shattering the pervasive myth of a deleterious shortage. Should this occur alongside rising unemployment and underemployment, falling aggregate demand, and calls for government to slam shut the immigration door, the combination of declining population growth and an oversupply of investment properties would place further downwards pressure on rents. Falling prices, rents and sales would be a doomsday trifecta for investors as they suffer losses in both capital prices and net rental incomes.
This calamitous outcome is especially likely in Melbourne where rents have not increased in real terms since 2010. Melbourne is primed to become the epicentre of a legendary housing market crash due to the combination of a staggering boom in real housing prices (178 per cent) and a similar trend in the total land values to GSP ratio. Historically, this city has tended to bubble more than Sydney, despite the latter capital’s larger size. Perth is also in a serious predicament following price stagnation and substantial net income losses since the market peaked in the March quarter of 2007. On average, investors purchasing after the peak have lost in terms of both prices and rental income. Worse yet, the end of the largest mining boom since the gold rushes of the mid-19th century will bear down further on Perth’s prices and rents, making it and Melbourne the leading candidates to post the greatest housing price correction. Other cities will experience a downturn, though not as large as Melbourne and Perth.
The majority of metrics point to the beginning of the housing boom in 1996 and peaking in 2010. As housing prices have steadied or fallen slightly across most of the capital cities, barring Sydney which has experienced another boom, the rampant overvaluation has eased somewhat between 2010 and 2013. Nevertheless, housing prices across all capital cities remain grossly inflated relative to rents, income, and total land values to GSP/GDP. What event or set of events triggers the beginning of the end of the housing bubble is not yet known.672 A bloodbath in the housing market, however, appears a near certainty due to the magnitude of falls required for housing prices to again reflect economic fundamentals. The largest residential land market bubble on record is truly incomparable and dwarfs earlier speculative episodes in the commercial land market.
Regardless of whether you agree with Egan’s and Soos’ views, you have got to commend them for undertaking such a comprehensive study – the most detailed of its kind – and, more importantly, making it freely available to the public.
Leith van Onselen is Chief Economist at the MB Fund and MB Super. He is also a co-founder of MacroBusiness.
Leith has previously worked at the Australian Treasury, Victorian Treasury and Goldman Sachs.