

Late last month, the Australian Taxation Office (ATO) released its Taxation Statistics for the 2011-12 tax year, which once again revealed that Australia is a nation of loss-making landlords.
If there is one thing that differentiates the Australian housing market from most others, it is the propensity for Australians to leverage into buy-to-let investment properties in the face of negative income returns, in the expectation that capital appreciation will repay debt and interest.
‘Negative gearing’, as it is known in Australia, is a popular form of leveraged investment in which an investor borrows money to buy an asset, but the income generated by that asset does not cover the interest on the loan. By definition, a negative gearing strategy can only make a profit if the asset rises in value by enough to cover the shortfall between the income received and the costs incurred from the asset. Alternatively, a negatively geared property may become neutrally or positively geared in a period of high rental increases.
Australia’s negative gearing rules are unusual in that they allow investors in both property and shares to write-off the cost of borrowing used to acquire an asset in addition to other holding costs against all sources of income (including labour income), not just the income generated by the asset. There are also no limitations on the income of the taxpayer, on the size of losses, or the period over which losses can be deducted.
By contrast, in most other countries, rental property expenses cannot be deducted against unrelated labour income, which effectively limits negative gearing to professional investors and developers.
To date, negative gearing has been a successful investment strategy in Australia. When combined with the Government’s decision in 1999 to change the nation’s capital gains tax (CGT) rules by halving the rate of tax payable on capital gains earned on assets held for more than 12 months, Australia’s strong house price appreciation since the late-1990s has allowed investors to make strong after-tax returns. There is a dark side, however, with investors increasingly crowding-out first home buyers from the property market, consigning an increasing proportion of younger Australians to a life time of rent, or paying-off jumbo-sized mortgages.
Australia’s insatiable appetite for investment property continues:
The ability of investors to minimise tax via negative gearing, combined with easier access to credit and the halving of CGT in 1999, has seen the popularity of property investment in Australia surge, as highlighted by the next chart:
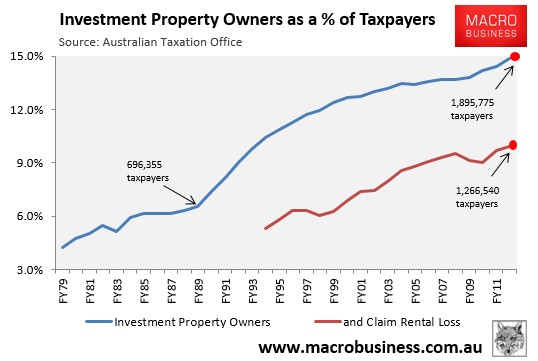
As you can see, Australia has morphed into a nation of landlords. In 1989-90, 696,355 taxpayers – 7.4% of the total – reported net rental income to the Australian Taxation Office (ATO). But in 2011-12, 1,895,775 did – 14.9% of total taxpayers.
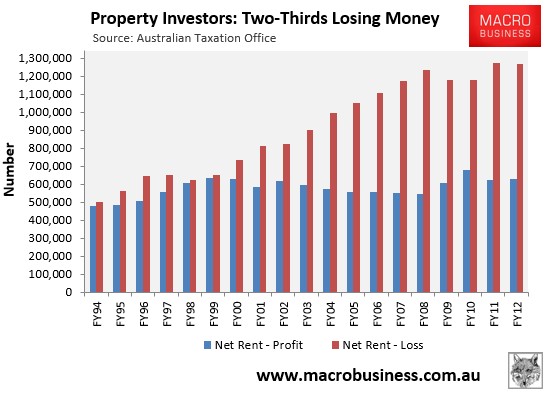
Moreover, in 1998-99, the number of investors claiming net rental profits (i.e. ‘positively geared’) was roughly equal to those claiming net rental losses (i.e. ‘negatively geared’). Since then, however, the situation has changed markedly, with the latest ATO data showing that there were just over 1.2 million negatively geared property investors in Australia in 2011-12, representing two-thirds of all property investment (see next chart).
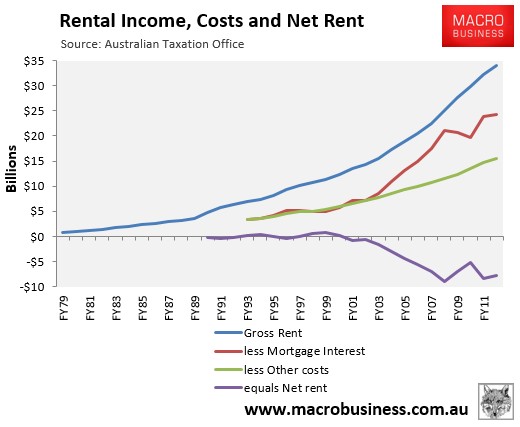
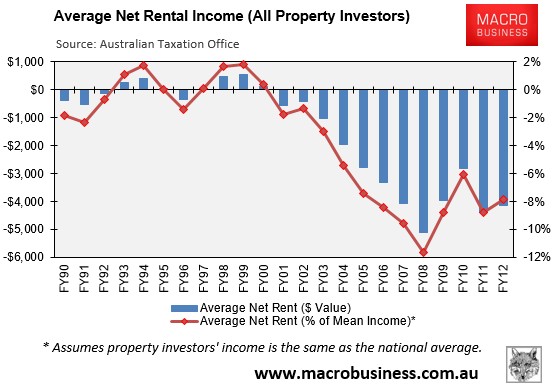
Up until 2000, property investment was more or less neutral from an income perspective, with aggregate rental receipts covering costs. From 2000 onwards, however, net rents deteriorated sharply; with aggregate losses totaling $7.9 billion in 2011-12 (see next chart).
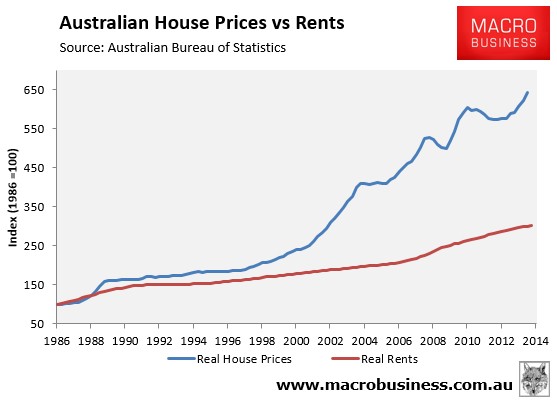
The worsening rental returns since 2000 are primarily accounted for by the strong appreciation of house prices relative to weaker rental growth (see next chart).
There are two logical explanations from the surge in negatively geared property investment (and property investment more generally) from the late-1990s.
First, financial deregulation led to a surge of new loan products in the mid-1990s, including those targeted at investors. These included interest only loans, as well as the new found ability to purchase an investment property through accessing equity in one’s existing home, without having to put in any cash up front, effectively allowing 100% debt financing of an investment property.
Second, the Federal Government’s decision in 1999 to halve the rate of CGT payable on capital gains earned on assets held for more than 12 months encouraged investors to speculate on rising housing values in full knowledge that any losses would reduce their overall tax liability, and any capital gains would be taxed at only half the rate of labour income.
The net result of these developments is that Australian investors have increasingly become Ponzi borrowers – Hyman Minsky’s term for borrowers who rely heavily on capital gains to repay debt and interest – in the belief that housing is a sure fire investment.
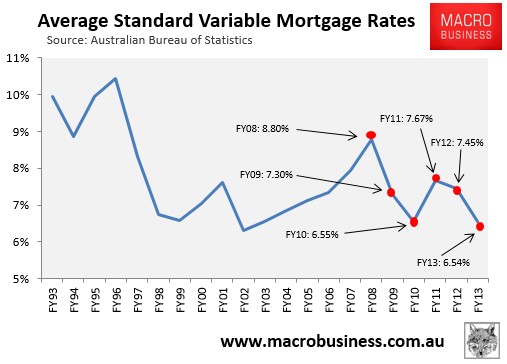
That said, aggregate rental losses in 2011-12 were lower than the 2007-08 peak when property investors claimed a record $9.1 billion of losses. They were also below the $8.3 billion of losses claimed in the prior financial year (2010-11). The fall in losses over this period was due primarily to a reduction in mortgage rates – from an average of 8.8% in 2007-08 to 7.5% in 2011-12 – which reduced the amount of mortgage interest payable.
As shown by the next chart, average mortgage rates decreased further to 6.5% over 2012-13, suggesting that next year’s release of the ATO Taxation Statistics (covering FY13) will likely reveal a further reduction in aggregate rental losses.
However, looking further ahead to 2013-14, it is likely that investor losses will increase once more. While standard variable mortgage rates have fallen further this financial year – to an average of 6.0% over the first 10 months – investor buying has ramped-up significantly at the same time as house price growth has decoupled from rents and rental yields have shrunk. This points to increasing negatively geared investment and rising overall rental losses, particularly in Sydney and Melbourne [more on this below].
Rental losses still comprise a significant proportion of income:
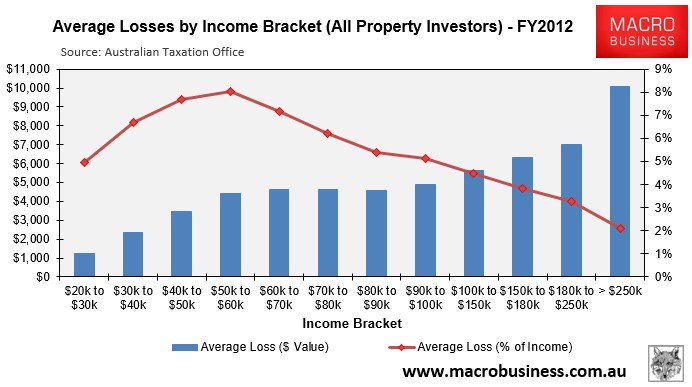
To put the overall level of income losses into perspective, rental losses across all investment properties nationally averaged $4,146 per investor in 2011-12, or 7.9% of average taxable income (see next chart).
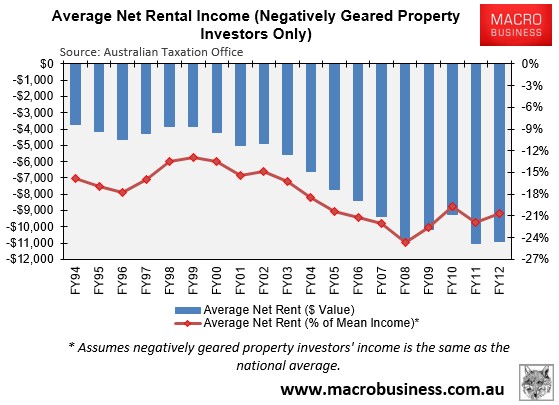
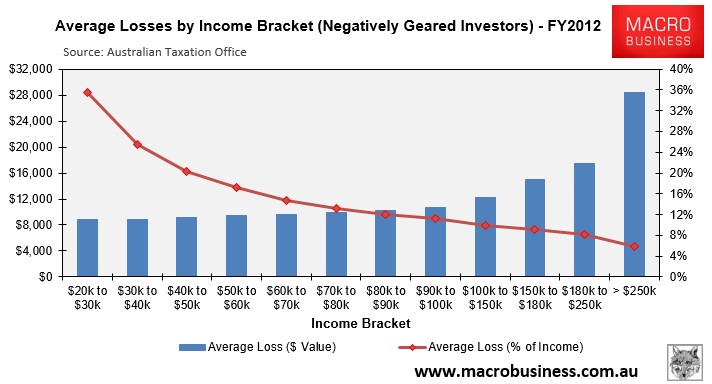
However, losses for negatively geared investors were much higher, totaling $10,895 per investor in 2011-12, or 21% of average taxable income (see next chart).
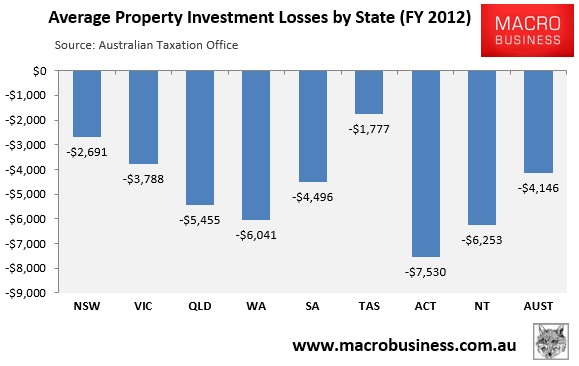
At the state and territory level, property investment is most pervasive in the Northern Territory and the ACT, with those two jurisdictions also incurring the highest income losses (see next chart).
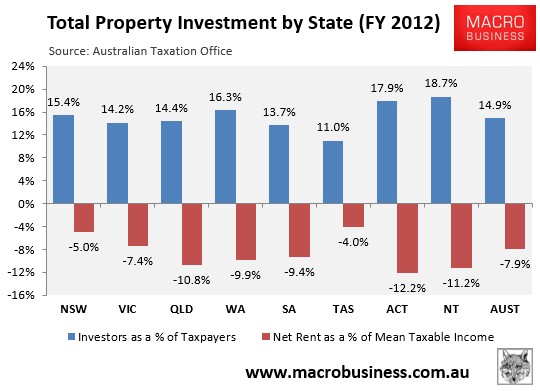
Similarly, actual average dollar losses per property investor in 2011-12 were highest in the ACT ($7,530) and the Northern Territory ($6,253), and lowest in Tasmania ($1,777) and New South Wales ($2,691):
Looking at negatively geared property investment only, investment is again most pervasive in the Northern Territory and the ACT, whereas actual income losses are highest in Queensland and the ACT: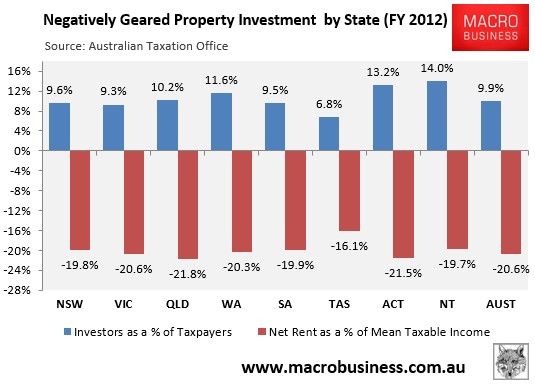
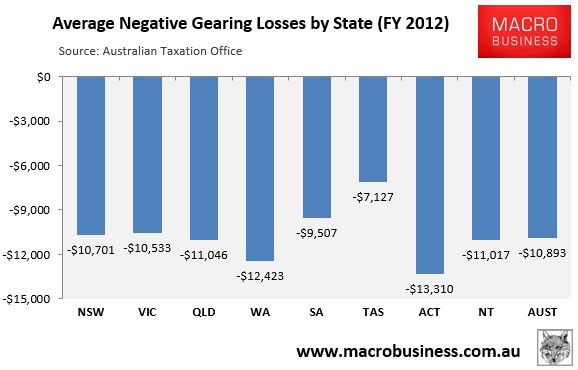
Finally, actual average dollar losses per negatively geared property investor in 2011-12 were highest in the ACT ($13,310) and Western Australia ($12,423), and lowest in Tasmania ($7,127) and South Australia ($9,507):
Still largely a middle-class affair:
According to the ATO Statistics, property investment is most popular amongst higher income earners, presumably due to the increased tax benefits on offer as one moves up the marginal tax scale.
In 2011-12, 35% of taxpayers earning over $180,000 held an investment property, with 24% negatively geared. By comparison, 15% of taxpayers earning between $50,000 and $60,000 held an investment property in 2011-12, with 11% negatively geared (see next chart).
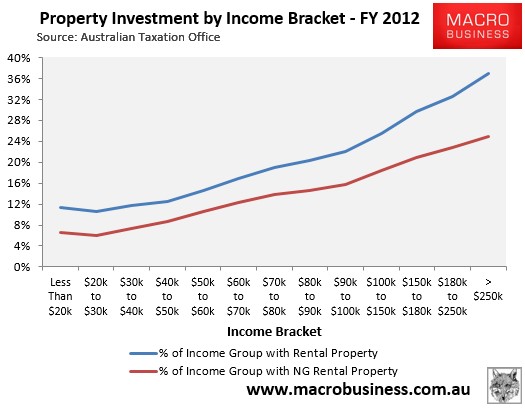
However, while property investment is more prevalent amongst higher income earners, the majority of rental properties are held by middle-to-lower income earners, with 72% of all property investors (62% of negatively geared investors) earning less than $80,000 per annum in 2011-12.
As illustrated by the next chart, the share of property investors residing at each income bracket fell as income levels rose in 2011-12:
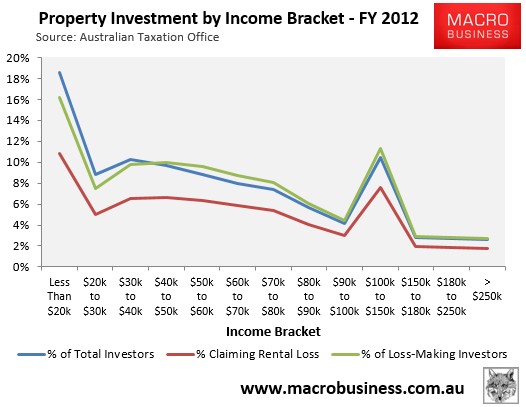
The average reported losses on investment properties are also a significant percentage of taxable income. In 2011-12, average net rental losses are mostly between 4% to 8% of income, with relative losses higher at lower tax brackets . This is despite higher income earners suffering significantly higher dollar losses:
For negatively geared investors only, average net rental losses were much higher in 2011-12, mostly comprising between 10% to 20% of taxable income. Again, percentage losses were heavily skewed towards the lower income brackets, with higher income brackets incurring higher dollar losses.
A renewed appetite for property investment:
In last year’s negative gearing Member’s Report, I hypothesised that there would ultimately be a “rush to the exits” as the baby boomers, who own the lion’s share of investment properties, retire en masse and sell down their assets to fund their lifestyles.
This view is based primarily by the fact that negative gearing is only attractive as a tax minimisation strategy when there is labour income to offset rental losses against. However, once the baby boomers enter retirement and ceases working, they will lose the ability to offset tax and negatively geared property investment will lose its attractiveness. Obviously, the incentive to sell-off property will be greatest amongst the lower-to-middle income earners that hold the bulk of Australia’s negatively geared investment properties, many of whom are likely also to be baby boomers.
That said, with the retirement of the baby boomer generation having only just begun, with the oldest members having turned 65 in 2011, this process could take a decade to play-out.
In the meantime, the financial repression from Australia’s record low mortgage rates has recently driven frenzied buying of investment properties.
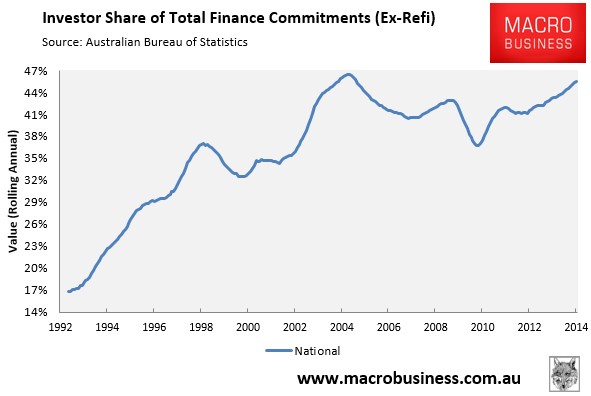
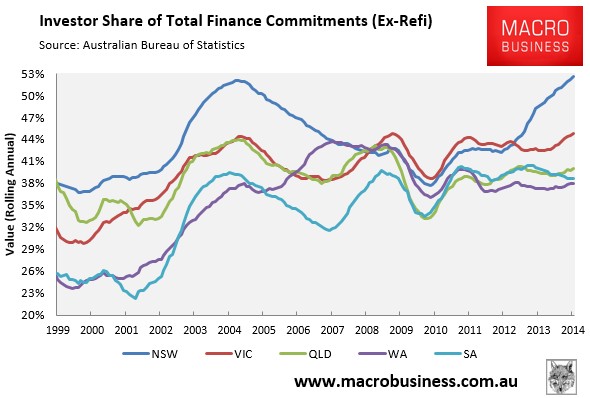
According to ABS housing finance data, the proportion of housing loans (excluding refinancings) going to investors has hit a near record 46%, a fraction below the peak reached in the year to July 2004 (see next chart).
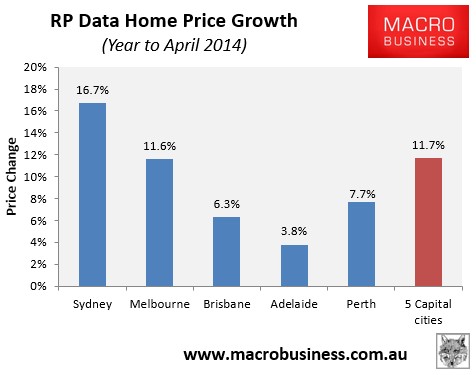
The recent surge in investor demand nationally has been driven by Australia’s two biggest states – New South Wales and Victoria – where investor mortgage demand has reached a record high 53% and 45% respectively, with both states also leading the nation’s price growth in the year to April, according to RP Data (see below charts).
But investor demand may soon evaporate:
Arguably, the current make-up of Australian mortgage demand is not conducive to sustainable house price growth. Investors, whose decision to purchase property are based on weighing-up alternative investment returns, are more likely to be fickle and cut-and-run as soon as conditions change, or more profitable opportunities are presented elsewhere. This places Australian housing on a more fragile footing than if demand was driven primarily by owner-occupiers, who tend to buy into housing for the longer-term.
Indeed, the strong run-up in prices, combined with soft rental growth, has caused rental yields to contract, particularly in Sydney and Melbourne. In the year to April, dwelling values across the five major capitals rose by 11.7% compared to rental growth of just 2.3%, with Melbourne and Sydney gross house yields plummeting to well below 4% (see below charts).
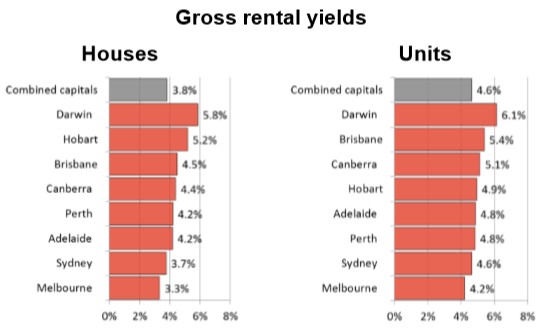
Expecting ongoing solid capital growth in the face of declining yield suggests a very strong belief in the “greater fool theory”, and is ultimately unsustainable.
Added to this view that investor demand will likely soon evaporate is the fact that Australian housing valuations are likely to hit their highest level on record later this year just as the economy embarks on its biggest adjustment since the early-1990s recession: falling capital expenditures as the once-in-a-century mining investment boom unwinds. Meanwhile, income growth is likely to remain anaemic as the unwinding of the biggest commodity price boom in the nation’s history continues to drag on national incomes. These factors combined should keep unemployment elevated and ultimately reduce the scope for sustainable house price and rental growth, in turn diminishing the potential returns from housing speculation.
As argued in our March Member’s Report, it remains our firm view that now is definitely not the time to be gearing-up into property speculation, with the risk of correction sometime in the near future arguably greater now than at any other time in living memory.
