The little iron ore derivative bounce carries on today with Dalian up another half percent and rebar futures a little as well and mining equities are following. Could we beat the bottom for iron ore?
There are two critical points of analysis in answering the question. The first is Chinese demand and growth. The second is how much iron ore is has stacked away in inventories.
On the first, recent evidence suggests growth has firmed around the 7% mark as mini-stimulus and external demand have stabilised after the first quarter swoon. However, the crucial residential housing sector remains weak and there’s been no sense at all of a lift in steel demand. From CLSA:
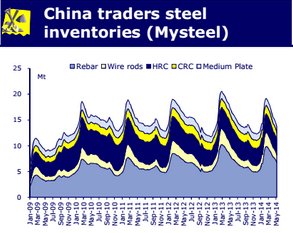
Despite the high production rate from CISA 10 days statistics, traders steel inventory fell to a new record low for the same period in history last week. Last year steel prices started to rise from mid-June when market realized inventory has been falling quickly and orders seem to be improving, this time however, the market is very conservative in interpreting the low inventory, with most people saying it is due to traders tight liquidity, increased direct sales from steel mills and inconsistency of production statistics coverage, instead of improved downstream demand, and we heard a few mills reported lower domestic orders from May.
Advertisement
That contention is obviously supported by low prices and high levels of Chinese exports. Without a sudden change in authorities’ minds about stimulus, which is very unlikely and would first need to see a trigger in diving growth prospects anyway, it appears leaner and meaner is the new normal in Chinese steel production.
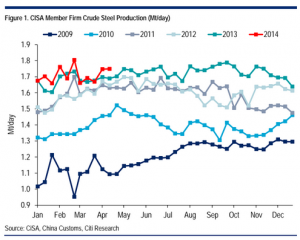
There is also seasonality to consider. Steel production typically falls away in the second half of the year. From Citi:
Advertisement
Note that 2009 and 2013 bucked the trend but only because both saw substantial stimulus. So, in all likelihood, steel production will peak and ease back in the next eighth weeks.
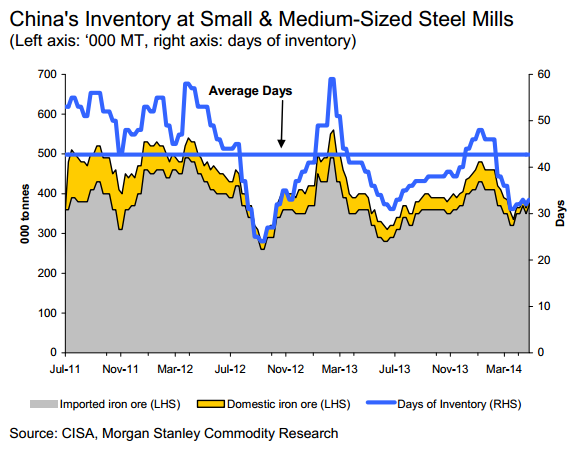
The second question we must address is how much raw material does China have on hand? It is the acceleration and deceleration of inventories that cause the big spikes in raw materials. There are different gauges of mill stocks. My Steel currently has days of use for iron ore at 24 days. CISA measures it differently and is higher, from Morgan Stanley:
Advertisement
Whichever you use, the pattern is the same with inventories around the mid year lows of last year but still some way above the lows 2012.
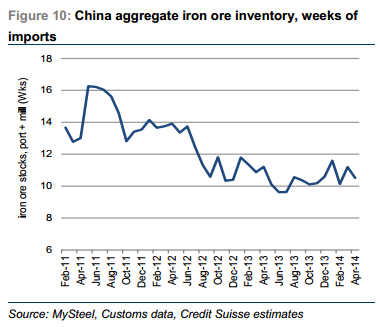
To this we can add the port stocks, which we know are huge, and Credit Suisee combines them to produce this chart:
Advertisement
The total is still in the mid-range of stocks since the 2012 step-shift.
In conclusion, unless something changes, the chances of a sustained iron ore rally are low. We could a little firmness for a while and equities can work off their oversold condition. Or, just as likely, the rally could peter out quickly.
I’ll stick with my fear that we’ll see new lows in Q3 as mills take raw material stocks to seasonal lows and even more new iron ore capacity pours into the market.
David Llewellyn-Smith is Chief Strategist at the MB Fund and MB Super. David is the founding publisher and editor of MacroBusiness and was the founding publisher and global economy editor of The Diplomat, the Asia Pacific's leading geo-politics and economics portal.
He is also a former gold trader and economic commentator at The Sydney Morning Herald, The Age, the ABC and Business Spectator. He is the co-author of The Great Crash of 2008 with Ross Garnaut and was the editor of the second Garnaut Climate Change Review.