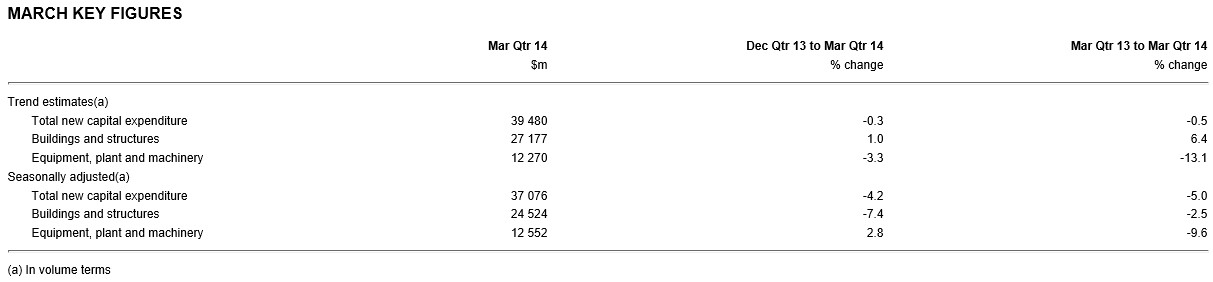
The Australian Bureau of Statistics (ABS) today released data on capital expenditures (capex) for the March quarter of 2014, which registered a seasonally-adjusted 5.2% fall in capex over the quarter and a 5.7% decrease over the year. The result disappointed analyst’s expectations of a 1.5% fall over the quarter (see below table).
While Houses and Holes has covered the more important capex intentions survey, which covers industry’s forward-looking capex plans over the coming years, below are some backward looking charts showing actual capex up to the March quarter of 2014.
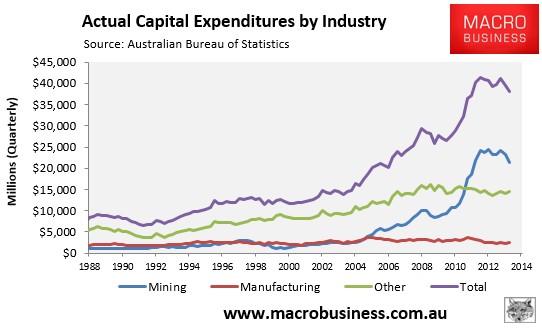
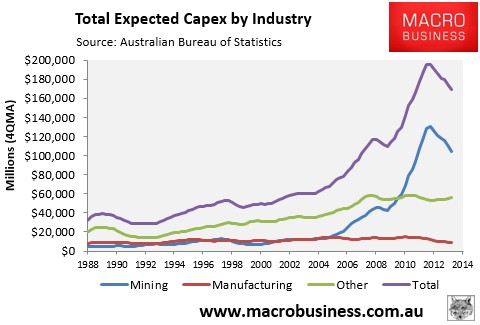
The first chart below shows actual capex by industry in dollar terms (rather than volume terms as shown above). As you can see, the fall in total capex (-3.7%) was driven by mining (-8.1%), with manufacturing capex (+2.8%) and other capex (+2.6%) both recording small rises (see next chart).
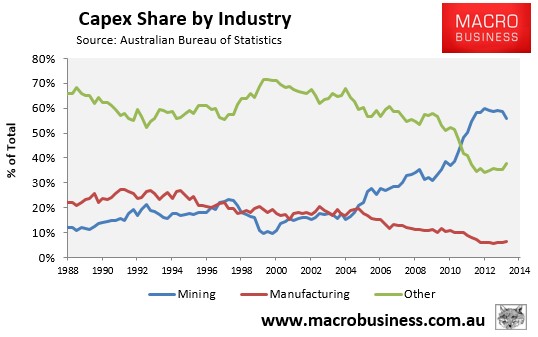
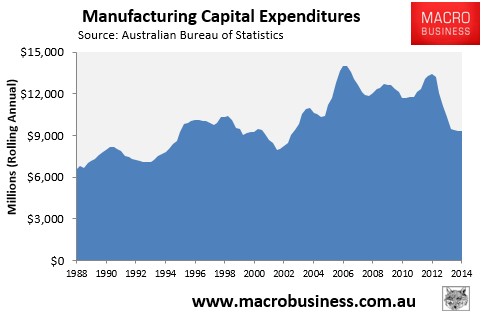
While manufacturing capex registered a small rise, it remains in the doldrums, with its share of total capex at a paltry 6.3% in March – although up 0.7% from the June 2013 low (see below charts).
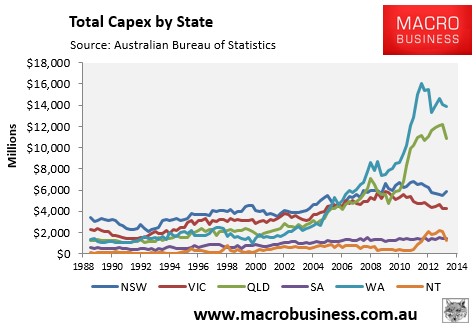
As expected, the fall in overall capex was concentrated in the mining jurisdictions of Western Australia (-$230 million), Queensland (-$1,282 million) and the Northern Territory (-$855 million). New South Wales (+440 million), South Australia (+$77 million) and the ACT ($+$24 million) bucked the trend, whereas Victoria was basically flat (-$10 million):
Looking ahead, the capex pipeline continues to trend lower, due to falling planned mining investment (see next chart).
Overall, this release should drag on GDP for the March quarter. Moreover, the longer-term outlook remains poor, with mining capex still facing a prolonged period of falls; although at least there are some offsets in manufacturing and other areas.
unconventionaleconomist@hotmail.com
