
The Australian Bureau of Statistics (ABS) has released trade data for the month of January, with Australia recording a seasonally-adjusted trade surplus of $1,433 million. The result surprised analysts, which had expected a trade deficit of $100 million.
It was the 3rd monthly trade surplus in a row and followed the $591 million surplus recorded in December (revised up from $468 million) and the $168 million surplus recorded in November (revised up from $83 million). The next chart shows the monthly breakdown:
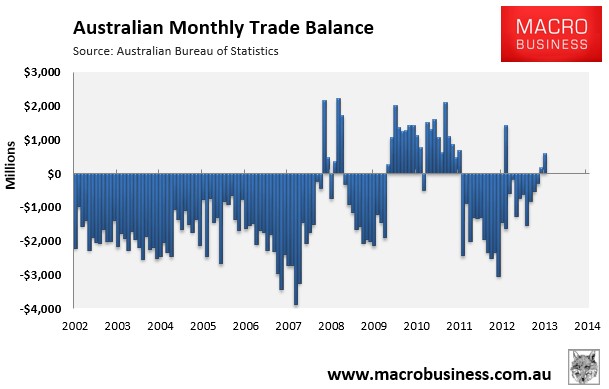
In seasonally adjusted terms, exports rose $1,068 million (4%) to $29,759m, whereas imports rose $226m (2%) to $28,327 million, with increases in Intermediate and other merchandise goods (up $753m) and consumption goods (up $47m) partly offset by falls in Capital goods (down $532m) and Non-monetary gold (down $95m).
The below data is presented in original (raw) terms, whereby the trade balance deteriorated by $4,324 million in January, with exports falling by $3,249 million and imports rising by $1,075 million.
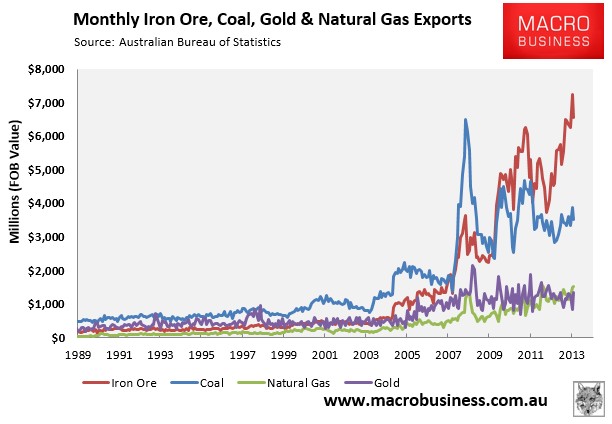
Australia’s biggest export commodity – iron ore (29% share) – fell by $683 million in January, as did Australia’s second biggest export – coal (16 share%) which fell by $362 million. By contrast, Australia’s third and fourth biggest export commodities – gas (7% share) and gold (6% share) – rose by $20 million and $482 million respectively (see next chart).
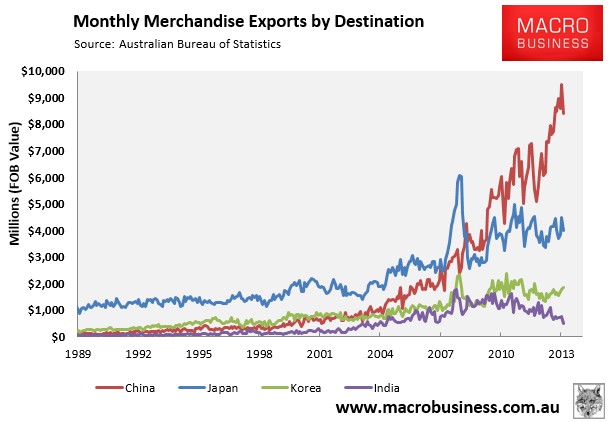
Exports to China – Australia’s biggest market – fell by $1,100 million (to $8,391 million), with its share of total exports at 37.5%. Exports to the second biggest market – Japan (18% share) – also fell by $519 million, as did exports to India – Australia’s fourth biggest export market (2% share) – which fell by $246 million. By contrast, exports to Korea – Australia’s third biggest market (8% share) – rose by $47 million in January (see next chart).
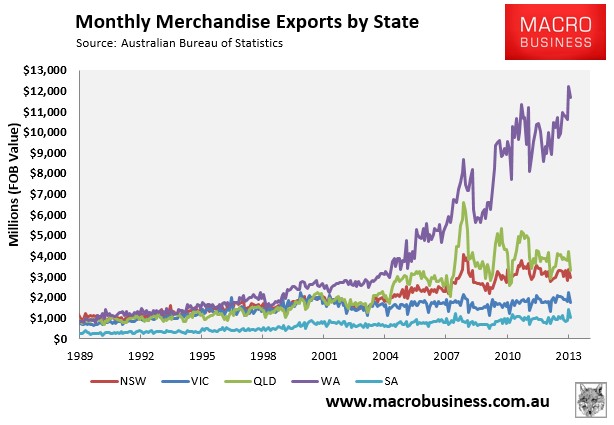
As always, Western Australia dominated the nation’s exports. It alone accounted for 52% of Australia’s merchandise exports in January, despite its exports falling by 4% over the month in original terms. Exports from Queensland also fell by 21% (see below chart).
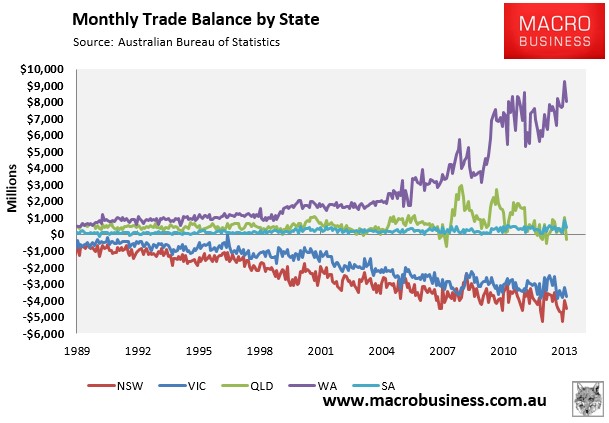
Again, Western Australia continues to be the state driving the nation’s trade surplus, although Queensland and South Australia are also more or less paying their way. By contrast, Victoria and New South Wales remain heavily in deficit:
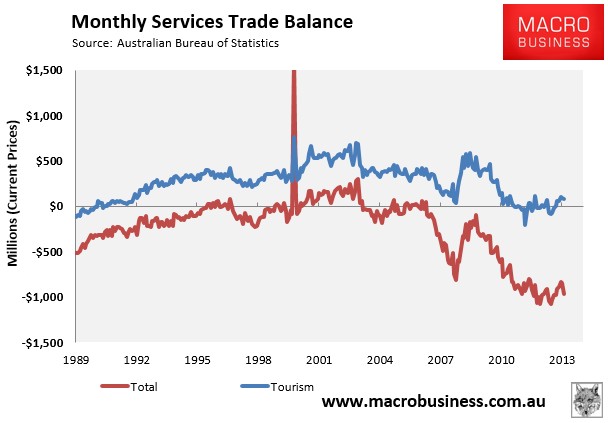
Finally, Australia’s services trade balance deteriorated marginally in January (-$162 million in seasonally-adjusted terms), with net tourism exports also recording a small fall (-$14 million):
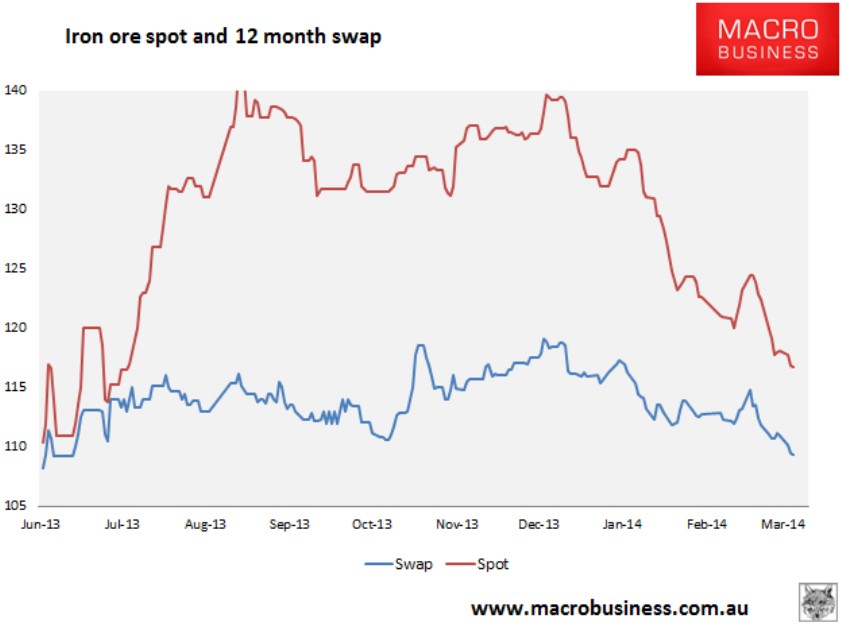
A key thing to watch over the remainder of the year is the extent to which falling commodity prices (particularly iron ore – below) offsets rising export volumes.
unconventionaleconomist@hotmail.com
