

As summarised earlier, the Australian Bureau of Statistics (ABS) today released labour force data for the month of February, which registered a 0.05% increase in the headline unemployment rate to 6.05% – the highest rate in a decade. The result was broadly in line with analyst’s expectations that unemployment would remain steady at 6%.
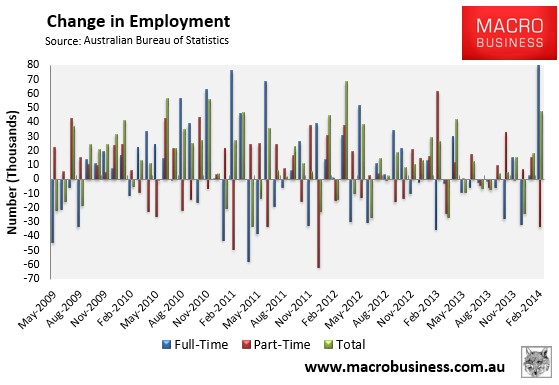
However, total employment increased by a seasonally adjusted 47,300 jobs, with full-time jobs rising by 80,500 to 8,049,900 offset by a 33,300 decrease in part-time employment to 3,480,900. That said, aggregate monthly hours worked fell by 14.0 million hours (0.9%) to 1,608.9 million hours.
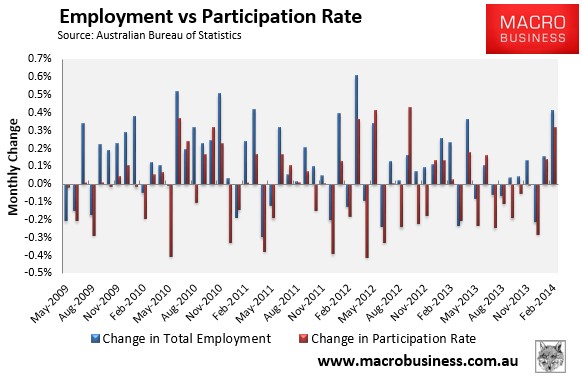
The participation rate rose by 0.2% to 64.8%, which more than offset the reported increase in jobs.
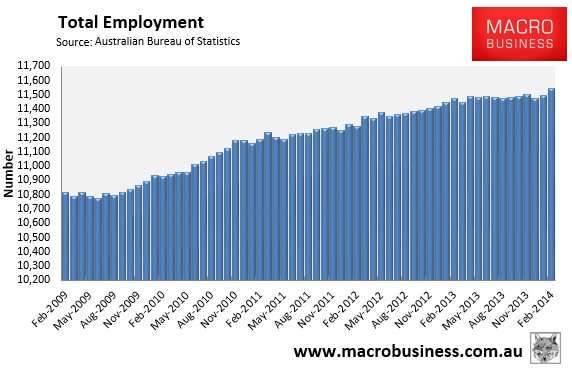
After nearly a year of stagnation, total employment has risen strongly (see next chart).
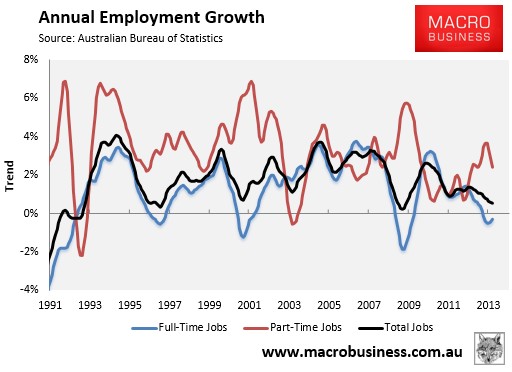
The bounce-back in full-time jobs is encouraging (up 0.5% over the year in seasonally-adjusted terms), it’s too early to pop the champagne corks, with growth still negative in trend terms:
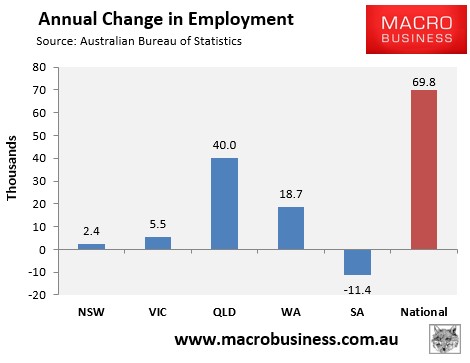
Four of the five mainland states added jobs over the year, although overall jobs growth was soft (see next chart).
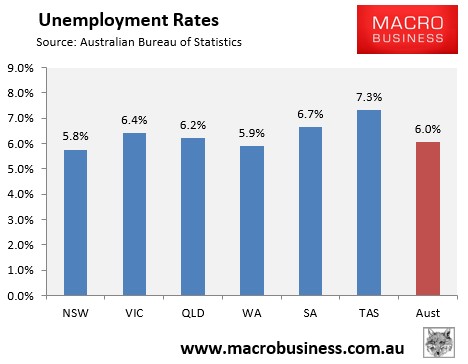
And the Southern States continue to have the highest unemployment rates (see next chart).
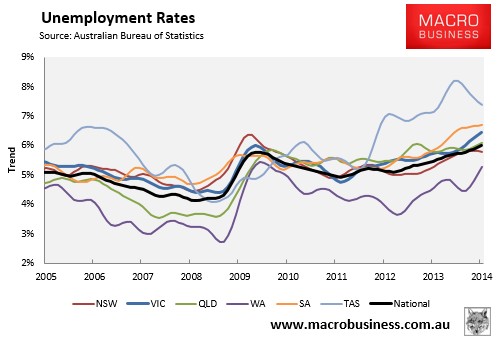
The state seasonally-adjusted figures are notoriously volatile and subject to a big margin of error. As such, the below chart shows the ABS’ trend unemployment rates, which shows Western Australia with the lowest unemployment (but rising), Tasmania and South Australia with the highest, and Victorian unemployment also rising:
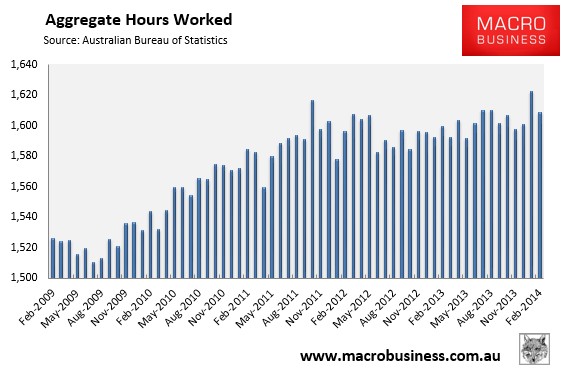
A negative from this release is that the aggregate number of hours worked fell by 0.9% in February and was up just 0.6% over the year:
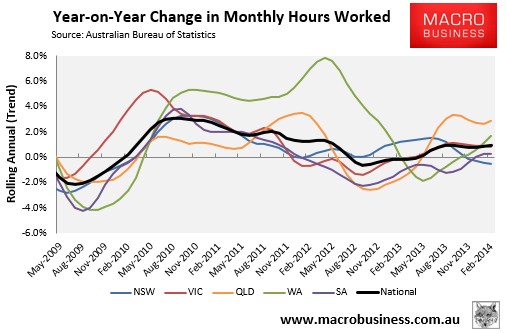
The below chart, which tracks the changes in hours worked on a trend basis, shows a mixed bag across the states:
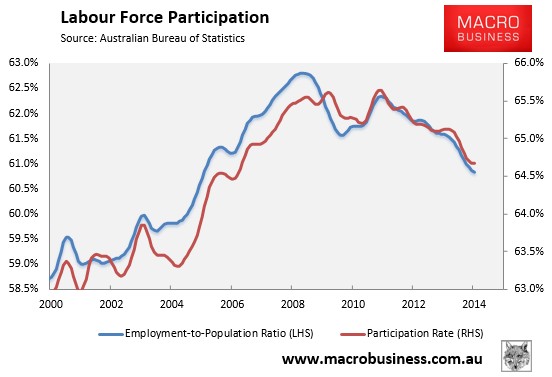
The employment-to-population ratio and the participation rate showed some moderate improvement in seasonally-adjusted terms (up 0.1% and 0.2% respectively), although both remained at around 9 and 7 year lows respectively in trend terms (see next chart).
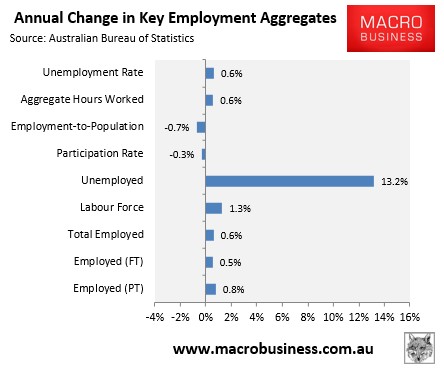
The below chart summarises the annual change in the key employment aggregates:
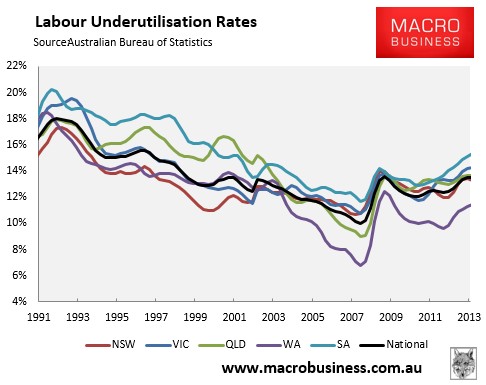
Finally, the ABS released its quarterly estimate of labour underutilisation, which remained at 13.5% – the highest level since May 1999 – suggesting significant slack remains in the labour force:
Overall, this is a mixed release. Despite the small increase in the headline unemployment rate, there was a strong rise in jobs, although this was partly offset by a reduction in aggregate hours worked. Obviously, the Australian labour market remains soft, with jobs growth still below the level required to absorb population growth.
We should also be cautious when a large rise in employment coincides with a significant jump in the participation rate, as has occurred this month. A similar result was reported this time last year, which ended up being driven by a rotation of the ABS sample. That is, new households entering the survey for the first time could have been more attached to the labour force than existing participants in the survey and so boosted both the level of employment and participation.
