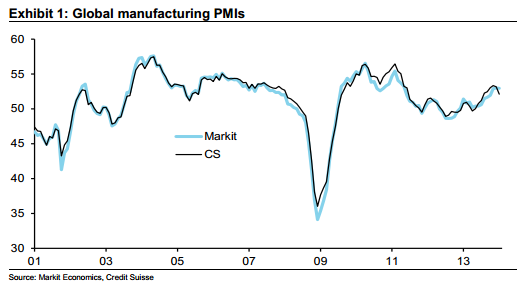
The global PMI fell more abruptly than expected to 52.1 in January from 53.2 in December. At first blush, a one-point move may not seem all that large, but in the context of these data, it represents one standard deviation. The monthly decline brought the index back to its lowest level since August 2013 – when global industrial activity started to pick up above its trend growth. We expected the global PMI to roll over, but the size of the monthly decline is somewhat of a surprise. The January reading is now consistent with the latest CS Basic Materials Index (CSBMI), which points to softer industrial production growth in the first months of the year (Flattening Back to Trend Growth).
The monthly fall was almost entirely due to the US ISM. China’s PMI also fell on the month and brought the EM PMI down, but only slightly – note that it was probably too early for the several pockets of instability in the EM space to have a meaningful impact on this month’s reading. On the other hand, the Japanese and the euro area indices showed signs of resilience. In fact, it is possible that, regarding Europe, the outsized loss of output endured over the last few years means that its business cycle could be somewhat desynchronized and consequently provide a buffer to global activity.
The recent pickup in global trade is reminiscent of stronger European and more generally global demand, in our view.
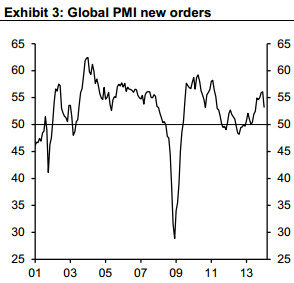
In the details, new orders fell aggressively by 3 points to 53.2 – its long-term average. The decrease in inventories (down one point) was not strong enough to offset the rapid fall in demand which, to some extent, darkens the production outlook. The latter remains nonetheless rather healthy thanks to reasonable fundamentals in developed markets, we believe.
In the US, the ISM index fell by 5.2 points to 51.3, the lowest level since May 2013. New Orders declined by 13.2 points to 51.2, the largest monthly decline since 1980. To be sure, the New Orders decline was from a very elevated 64.4 level, a zone where the index often peaks. The 51.2 result is hardly a disaster, but this was still a serious disappointment.
The ISM press release leaned on weather as a possible explanation for the weakness: “A number of comments from the panel cite adverse weather conditions as a factor negatively impacting their businesses in January.” We take these comments at face value, and the significant decline in the index could be suggestive that weather was indeed a factor. Still, we are somewhat skeptical that the weather was the only culprit, as ISM and factory activity in general is typically not as weather-sensitive as other sectors, such as construction. The February figures will be the real test.
In recent years, ISM has become a better indicator for global industrial production than US production. At first blush, these data are consistent with our house view that expects a “momentum peak” in global industrial production in Q1. These data are also flagging the possibility of a significant inventory reversal in the US GDP data, where inventories have been a substantial contributor in recent quarters. Note the Inventory Index was quite low at 44.0 and slowdowns in the New Orders and Inventory indices often coincide with inventory reversals in GDP.
David Llewellyn-Smith is Chief Strategist at the MB Fund and MB Super. David is the founding publisher and editor of MacroBusiness and was the founding publisher and global economy editor of The Diplomat, the Asia Pacific's leading geo-politics and economics portal.
He is also a former gold trader and economic commentator at The Sydney Morning Herald, The Age, the ABC and Business Spectator. He is the co-author of The Great Crash of 2008 with Ross Garnaut and was the editor of the second Garnaut Climate Change Review.