
Find below the iron ore charts for February 14, 2014:
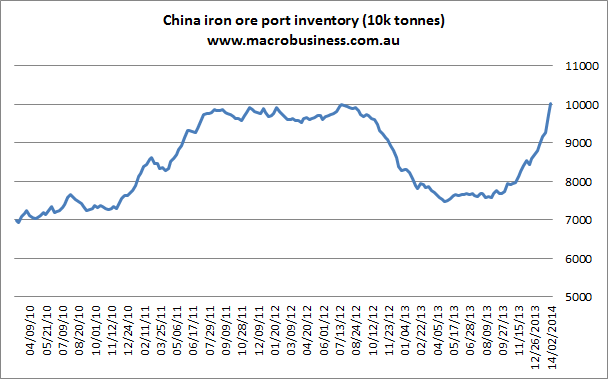
Some more post holiday demand has appeared as the early year steel build is underway. That’s the good news. There’s two more data series that makes it all look as shaky as the San Andreas fault. Port stocks have now hit the highest level ever on a trajectory that one can only describe as parabolic:
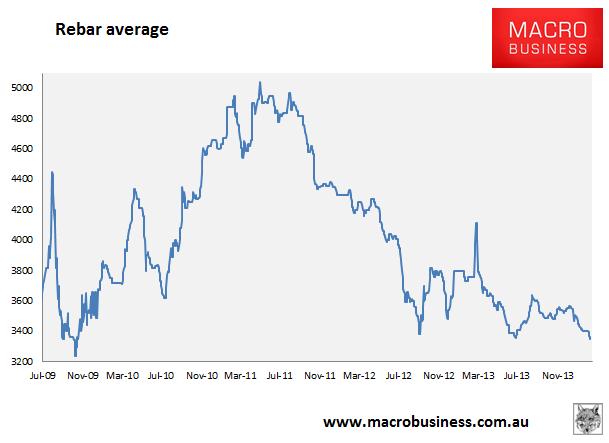
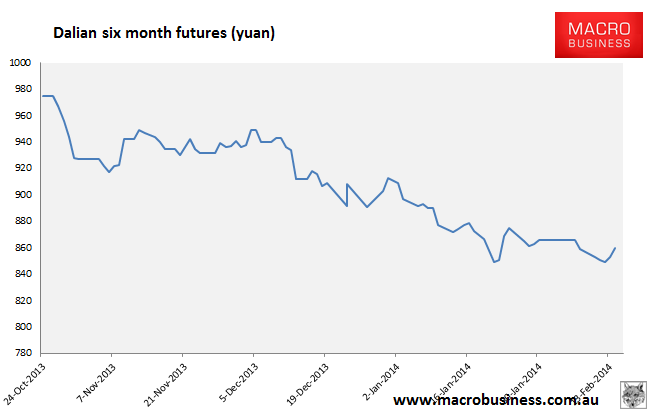
And rebar average prices have plunged to their lowest level since the GFC (rebar futures had a better day, up a little):
In short, masses of red dirt and nobody buying steel. I won’t harp on it but can only repeat that this combination bodes poorly as Q1 passes. Indeed the word that most comes to mind to describe the current situation in the Chinese iron ore market is “blowoff”.
I thought I might check in my old spread charts today and see what light they can add. First, iron ore spot versus the 12 month swap:
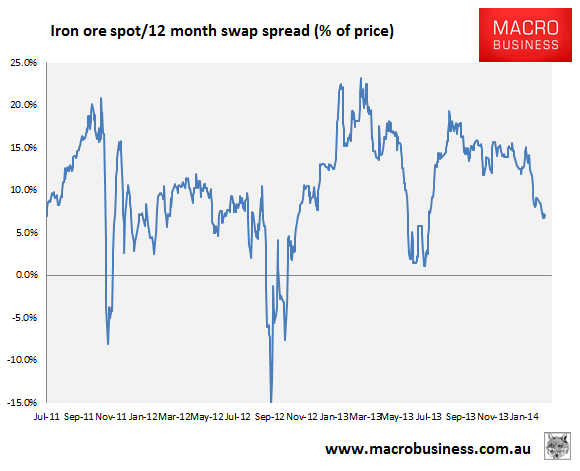
Quite compressed and certainly in a historically consistent range. One might interpret the passing of last year’s fattened spread as evidence that the shortage created by the departure of Indian iron ore has now been filled.
And spot to rebar:
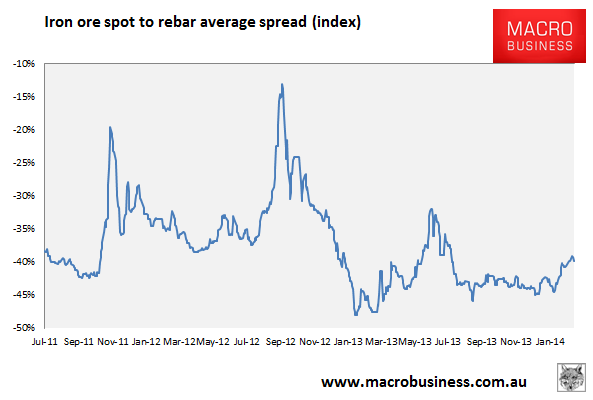
Still very wide in historical terms with much room to close as iron ore catches up to the reality of a Chinese steel market burdened by oversupply, weak demand and zero profitability.
