Westpac’s Elliot Clarke has produced an interesting note today on the increased purchasing by Self-Managed Superannuation Funds (SMSFs) of Australian residential property:
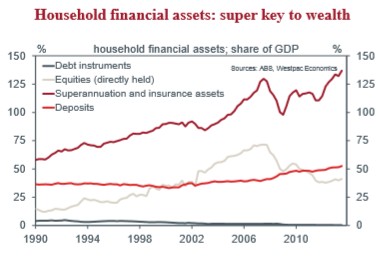
Superannuation is the principal form of savings for Australian households outside of the family home. As at September 2013, household superannuation assets stood at just over of $2trn – $1.7trn in super funds and a further $0.4trn in unfunded super obligations of the Federal and state governments. That equates to around 56% of household’s total financial assets; it is over two and a half times the size of household deposits and three times the total value of directly held shares.
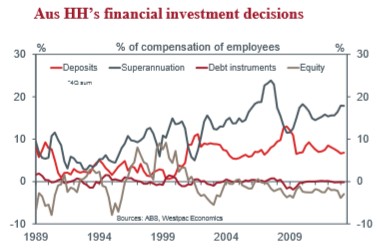
Partly due to our ageing population, superannuation shows no sign of losing its appeal. Around 18% of total worker compensation currently flows into super annually, with superannuation seen as being an integral part of households’ total portfolio of real and financial assets.
But what has changed over the past five to ten years has been the way in which households choose to manage their super. As highlighted by the RBA recently, there has been a marked shift away from industry and retail funds towards self-managed superannuation (SMSFs). Of the $1.7trn invested in super funds as at September 2013, more than $0.5trn was self managed. Further, whereas SMSFs had previously been the domain of older, well-off workers, increasingly they are attracting the attention of younger workers from a larger subset of the income spectrum.
Given the broadening interest amongst the population, now seems an opportune time to consider the implications of SMSFs for households’ welfare…
SMSFs also have a high proportion of their funds invested in Australian equities, circa 30%. However, direct holdings of foreign equity are non existent. Note it is possible that there is a residual exposure to foreign interests via managed investments which SMSFs have invested around 20% of their assets in – incorporated as part of the ‘other’ category in the top chart and includes all types of foreign and domestic assets. The balance of SMSFs exposures are focused in cash (around 30%) and property (around 15%). As for direct foreign equities, SMSFs exposure to debt instruments (domestic and foreign) is negligible.
The net effect of these divergent exposures is that SMSFs are much more exposed to cyclical developments in the Australian economy than institutional super funds…
Going further, it is possible that the absence of a diversified supply of investment instruments to SMSFs has been one of the key factors behind this sector’s recent demand for investment housing. Housing is an asset which has both debt-like (rental yield) and equity-like (potential capital gain) attributes. For investors short of options, such an asset class holds great appeal. This is all the more true considering Australian investors past experience with housing, with its strong historic gross investment returns relative to equities which are still below pre-GFC highs…
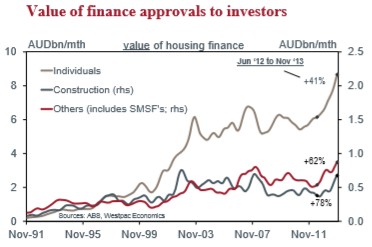
There is a real dearth of timely data in this area, in part because of its fledgling status as an investment option, and also because of the complexities of recording all the necessary details for each transaction. That being said, the ABS housing finance release provides a way to quantify this demand…
According to the ABS, lending to SMSFs is accounted for in the ‘other’ investor category. The total finance offered to this group has increased by around 62% since June 2012, albeit in a volatile fashion. Taken at face value, this growth points to an increase in residential property’s share of SMSF total assets, from around 4% to over 6%. The true scale of the increase depends on the proportion of total ‘others’ lending taken up by SMSFs, the LVR for each mortgage, and the value of cash purchases, none of which is directly observable.
It is worth noting that there are two key factors which may have led to these lending figures underestimating the shift in SMSF portfolios. First, because the benefits of negative gearing are not available within SMSFs, there is an incentive to restrict leverage in these transactions. An (arbitrary) example highlights the value bias potentially created by reduced loan-to-value ratios (LVRs) for SMSF lending: a LVR of 70% versus 100% would see SMSF borrowing 30% lower in value terms for any given portfolio of loans. This implies that SMSF-driven market transaction volume could be higher than the 62% value increase the ABS reported.
Of more significance is that the housing finance data only includes committed finance agreements. As a result, cash purchases and ‘off the plan’ purchases without a finance pre- commitment are not counted. There is no real way to assess the scale of these purchases as a proportion of total transactions. However, given the many press reports of strong demand for off- the-plan purchases and the 78% growth seen in the construction investment loan series (which captures pre-commitments for dwellings under construction purchased by all investors), it is plausible that SMSFs have had an additional (statistically unreported) impact on the property market, particularly in Sydney and Melbourne.
All told, we have seen an abrupt change in the size of the flow of new residential investment by SMSFs (some of which may not have been reported to date), but their share of total SMSF assets is still relatively limited at around 6%, if the housing finance trend proves accurate. Further strong activity flows would be necessary if this share is to rise to the level of commercial holdings (12%).
From the perspective of the aggregate housing market, it is then apparent that SMSFs have been (and likely will remain) a marginal demand impulse. At November, lending to ‘other’ investors totalled about 4% of ex-refinance lending compared to 40% for individual investors and 53% for owner occupiers.
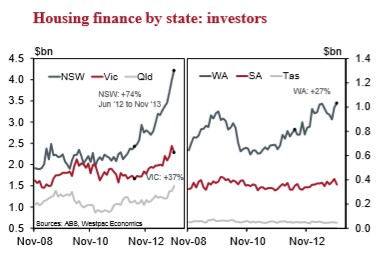
The more important trend apparent in this data then is the role total investor activity is playing, not just SMSFs. Investors’ share of total (ex-refinance) lending has only been higher during one period in its history (late 2003/early 2004). Further, this activity has largely been concentrated in NSW (+74%, Jun ‘12 to Nov ‘13) and VIC (+37%). Only time will tell if this historically-high and geographically-narrow investor demand will prove to be a temporary or enduring support for housing, and to what extent it will impact the broader economy.
Leith van Onselen is Chief Economist at the MB Fund and MB Super. He is also a co-founder of MacroBusiness.
Leith has previously worked at the Australian Treasury, Victorian Treasury and Goldman Sachs.