The Housing Industry Association (HIA) today released its quarterly housing affordability index for the September quarter of 2013, which registered another improvement. From the Media Release:
The good news on housing affordability continued in the September 2013 quarter with improvements driven by further interest rate reductions, said the Housing Industry Association, the voice of Australia’s residential building industry.
The HIA-Commonwealth Bank Housing Affordability Index increased by 3.2 per cent in the September 2013 quarter to a level of 75.1. The aggregate capital city affordability index increased by 2.6 per cent over the September 2013 quarter to reach 72.2, a level that is 15.2 per cent higher than in the September 2012 quarter…
“Despite widely-publicised dwelling price increases in some markets in recent months, affordability has continued to improve as a result of reduced interest rates,” commented HIA Senior Economist, Shane Garrett.
“Since late 2011, the RBA has cut rates by a total of 225 basis points, including reductions in both May and August of this year. As a result, the discounted variable interest rate for mortgages has declined from 7.05 per cent to 5.18 per cent over the same period,” pointed out Shane Garrett.
“Affordability has been further enhanced by continued increases in weekly earnings over the past year,” added Mr Garrett.
The below chart plots the time series since 1994. As you can see, housing affordability is apparently at an 11-year high, according to the HIA:
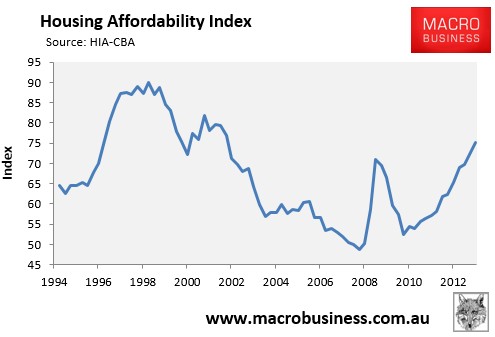
As argued many times previously, I have concerns about this index. How it can claim that housing affordability is currently well above mid-1990 levels is beyond me, given that the median capital city house price in 1994 was only around $150,000 (compared with around $575,000 currently, according to APM) and variable mortgage rates were just under 9.5% (versus 5.05% currently).
Moreover, averaging out the results from Australia’s four main house price data providers – the ABS, APM, RP Data, and Residex – showed an increase in values of 2.4% over the September quarter. Given that variable mortgage rates fell by only 0.25% over the quarter, and wages growth was soft, I fail to see how housing affordability could then have risen by a large 3.2%, as proclaimed by the HIA.
More broadly, housing affordability (i.e. the cost of the home relative to incomes) and mortgage serviceability (the immediate cost of servicing the loan) are not the same thing. The former has only improved modestly in recent years, whereas the latter has improved significantly thanks to the reduction in interest rates, which are unlikely to always remain so low. In this regard, the HIA’s index should really be labelled a “mortgage affordability index”, since it measures the current cost of obtaining a mortgage on a median priced home, not the structural cost of housing per se.
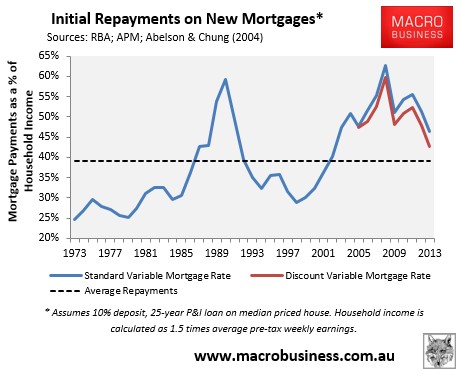
For what it’s worth, below is my own mortgage affordability index, with median house prices derived from Abelson & Chung (2004) and APM, variable mortgage rates from the RBA, and household income measured as 1.5 times average pre-tax weekly earnings. As you can see, mortgage affordability has certainly improved in recent times, although it remains below the long-term average.