

Australian Property Monitors (APM) has released its June quarter house and unit price results (below), which recorded a 2.8% increase in house prices over the quarter at the national capital city level, and a 2.0% rise in national capital city unit prices.
In the year to March 2013, APM recorded a 3.2% increase in national capital city house prices, but only a 0.7% rise in unit values.
Looking at the capital city breakdown, you can see that Melbourne led house price growth, with prices jumping by 5.0% over the quarter. Perth (+3.2%), Sydney (+2.7%), and Canberra (+1.8%) also recorded solid gains, whereas prices fell in Darwin (-2.1%) and Hobart’s median price was flat.
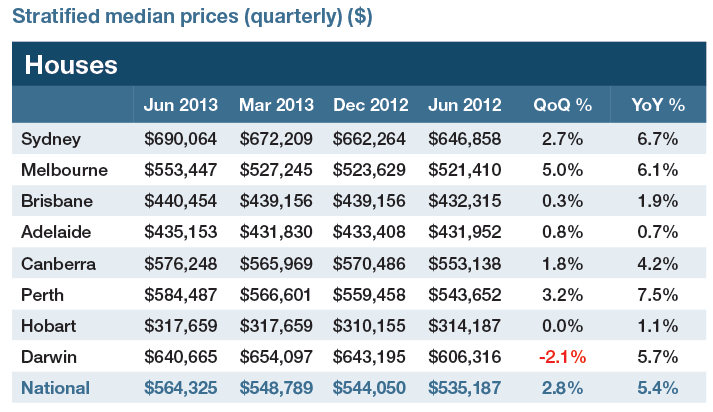
It should be noted, however, that some of the reported price movements were caused by revisions to the prior quarter, which particularly affected Melbourne’s result. The median price changes excluding revisions are shown below:
- Sydney: 2.4%
- Melbourne: 2.7%
- Brisbane: 0.4%
- Perth: 3.4%
- Adelaide: 1.8%
- Hobart: 2.8%
- Canberra: 1.5%
- Darwin: -1.9%
- National: 2.3%
Nevertheless, according to APM, prices set new all-time highs in nominal terms (still down in real inflation-adjusted terms) in Sydney and Perth.
Unit price performance was mixed. Melbourne (+3.7%), Perth (+2.5%), Sydney (+2.4%), and Adelaide (+1.2%) all recorded solid gains, whereas Hobart (-7.3%), Brisbane (-2.4%), and Canberra (-1.3%) recorded losses.
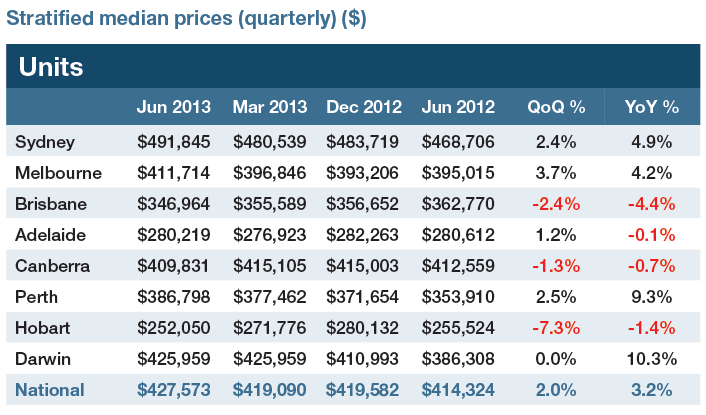
Again, results excluding revisions to the March quarter are shown below:
- Sydney: 3.8%
- Melbourne: 2.4%
- Brisbane: 0.2%
- Perth: 4.1%
- Adelaide: -0.2%
- Hobart: -6.5%
- Canberra: 2.9%
- Darwin: 0.2%
- National: 2.4%
APM uses a similar stratified median methodology to the Australian Bureau of Statistics (ABS), which suggests that the ABS will also record growth nationally when its house price index is released early next month (although the two series do often diverge).
