Trading Week: Australian dollar, stocks special


By Chris Becker
Given the falls in our market this week – the backdrop being dramatic volatility in the Japanese stock market – and amid the continuous “analysis” of the Australian dollar in mainstream media, I thought this installment of Trading Week should focus on Aussie stocks and the “battler”.
As I said in previous editions, something is afoot with the AUD/risk-on/commodity nexus. Stock markets continue to rise (well, US ones), commodities rebound/consolidate (copper is slowly rising, WTI crude steady, natural gas also), but the “battler” crumbles. Are we seeing the start of the great Australian adjustment, or should we take heed since Goldman Sachs recently announced an AUD short as the trade du jour?
Remember, the following views are my own, do not constitute advice and are for information purposes only. I may have positions in any or all of the below and their associated markets both long and short, on an intra-day, daily and weekly basis for my own account. Please seek advice from a licensed adviser before making any investment decisions.
Let look at the “battler” (AUDUSD) first, since it’s the most mentioned. Again, let’s step back and look at the monthly chart first, using candlesticks (click here for a quick primer on candlesticks) because I think this is the clearest way to look at the big picture (note, this is just a sketch of possible tactics not a recommendation):
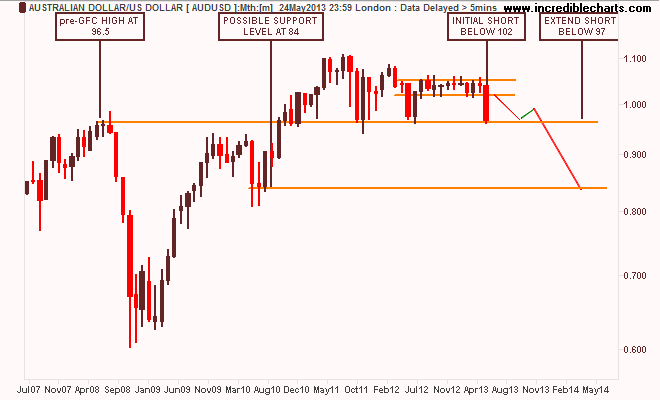
As you can see, since July 2012, the AUD had been in a very tight band between 1.02 and 1.06 which is now clearly broken, but not to the general level of support at 96 to 97 cents, last seen during the previous two down cycles in the “Great Volatility” and the height before the GFC.
The next level of support is 84 to 86 cents, which is my probable medium term target if price drops below this level, and from a macro point of view, probably not good enough for the economy in the long run…
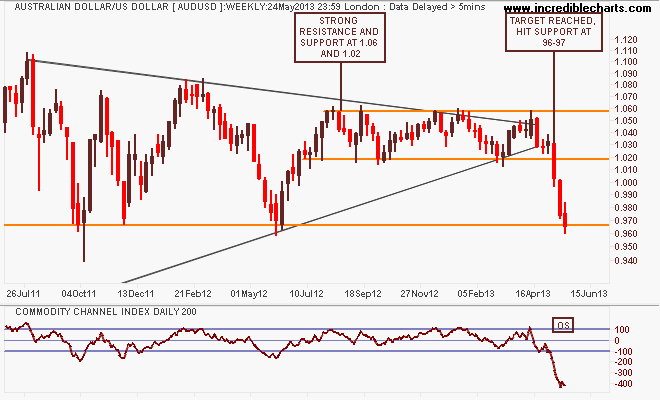
The weekly chart shows this a bit clearer, with the AUDUSD looking considerably oversold, in fact the sharpness of this move equates to the fall during the GFC, so a sharp bounce up is not to be unexpected. Cue the “everything is fine” media analysts if this happens, until…
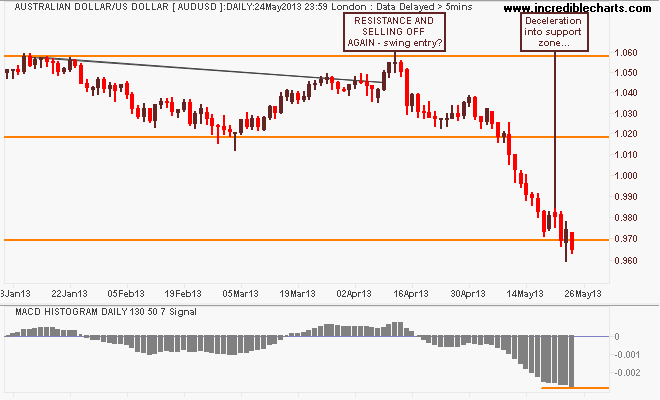
The daily chart remains painful to look at if you weren’t short, or said the AUD was going to $1.50. In the short term the AUD has decelerated, although fell again on Friday night, into the support zone. For now a little bit of USD weakness is holding these current levels, but contrary to learned opinion, currencies don’t just float down and land softly: watch out below!
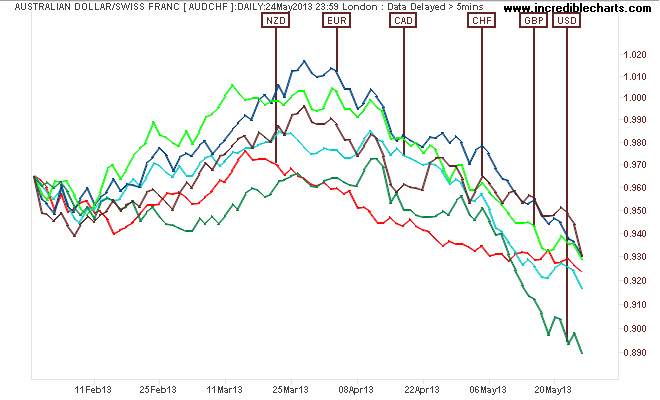
USD is now the strongest against the AUD, that bit is true, but let’s put falls against other major currencies into perspective here too. Good news for exporters (bad news for travelers, but I’m glad the family members that asked me “should I buy GBP or USD now” earlier this year for their northern hemisphere summer holiday had done so):
And just because I think there is something here – although my colleague Greg McKenna says I shouldn’t touch it at all (at least intraday…) – I continue to look at the historical price action in the AUD/NZD cross for some interesting possibilities…
Here it is post the last recession in Australia (early 1990’s for those of you too young to remember):
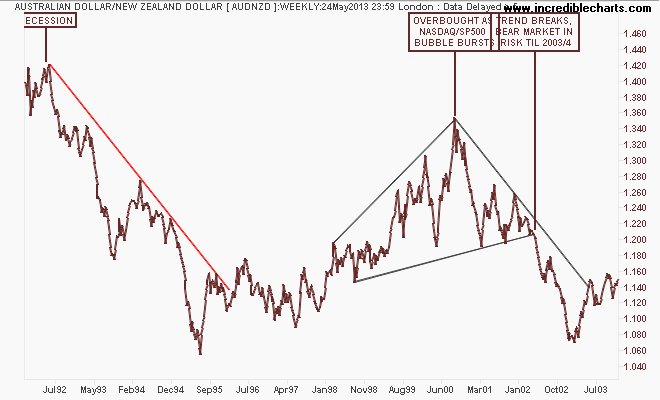
Note the steep decline post the recession before AUD became bid during the NASDAQ bubble, which subsequently burst as risk markets went into bear mode from 2001-2003, before China stepped in and re-inflated it all again. Now note the current timeframe:
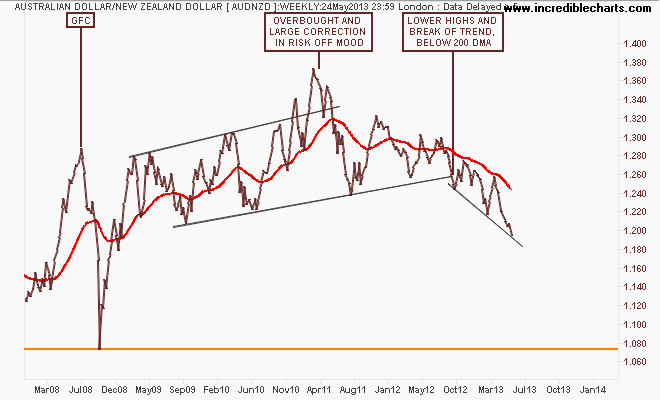
Again, AUD is bid against everything, but in recent months a series of lower highs and a clear break of the trend line from the GFC has seen the Kiwi increase in value against the AUD. Not a good thing if you like to travel to NZD (although still cheaper than travel within Oz), or want to buy NZ assets. Which is my real motivation here, not to provide any insight!
Now to our local share market, the S&P/ASX200 index again using a “fractal” view. I still contend that the market is only halfway through its own secular bear market, and historically still has approximately 5-7 years to go before it reaches its former high at 6700 points. Only problem with that theory is that recent high was because of hugely expensive banks and speculative action in mining stock prices due to the 2003-2007 China bubble…..
Note these important levels before moving on: the key levels at 3800-4000 (strong support), 4400 (intermediate resistance and the outer edge of the index’s real value), 4900-5000 (strong resistance) and 6850 (the former high of the 2003-2007 bubble).
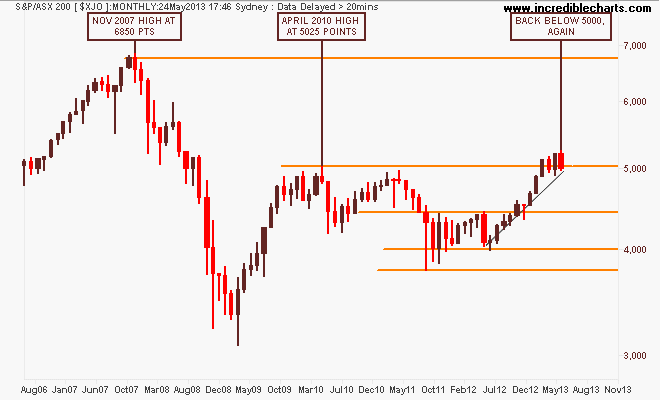
The key level here is 5000 points, obviously, which should form strong support for further rallies or consolidation to come. But there’s a slight problem with that theory…
My medium term view remains that this rally has been unsustainable and fraught with danger, as the RBA eased rates to (hopefully) re-inflate the housing sector as the mining investment cliff approaches.
This current rally has been almost completely on the back of the banking sector (with some help from industrials and defensives on yield chasing), which is completely dependent on an easing cycle in interest rates AND continued increases in national income AND access to wholesale credit markets at cheap prices.
As I’ve been warning for quite some time now:
That the materials sector has corrected sharply during this time as commodity prices came off the boil while Chinese authorities try to transition their economy continues to add to the risk of a correction and back to the trajectory from the first uptick in the August 2012 lows, around 4600-4700 points.
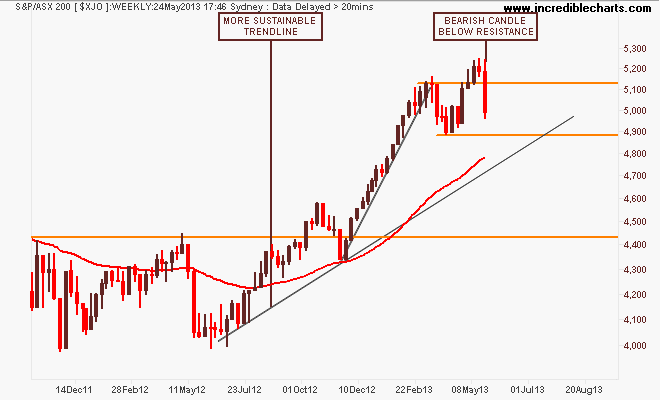
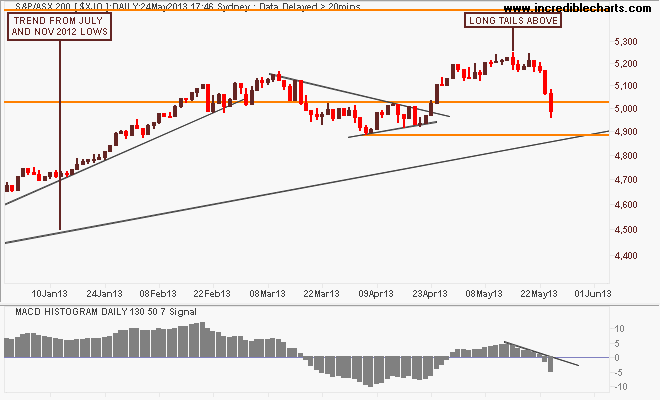
We can see on the weekly chart that this parabolic rally slowed down as it broke through 5000 points, rebounded as it absorbed “Bank Week” results, but last week’s spinning top candle as the AUD cracked has put the first phase of the correction underway. The probable target is the more sustainable trendline or the 200 day moving average (in red):
On the daily chart this trajectory is even clearer. My preferred MACDH setting has switched to sell/stand aside with the possibility of further falls if support at 4900 points is breached:
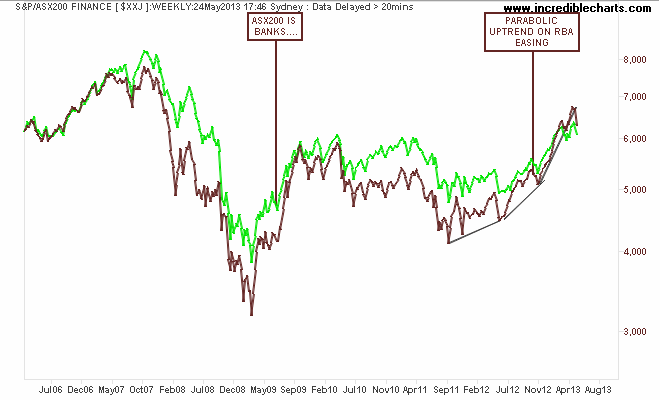
Let’s take a more honest look at what the ASX200 really is – the banks – here’s the weekly chart going back to pre-GFC time, showing huge correlation:
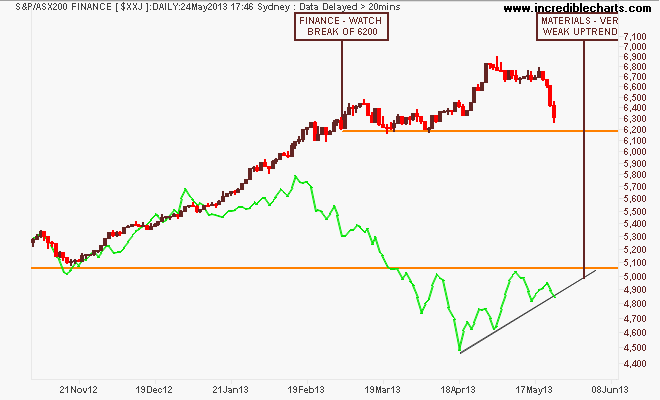
Here’s the financials and materials (green) sector daily charts compared. Note it is the banks, not materials dragging the bourse down, whilst the latter are still very weak:
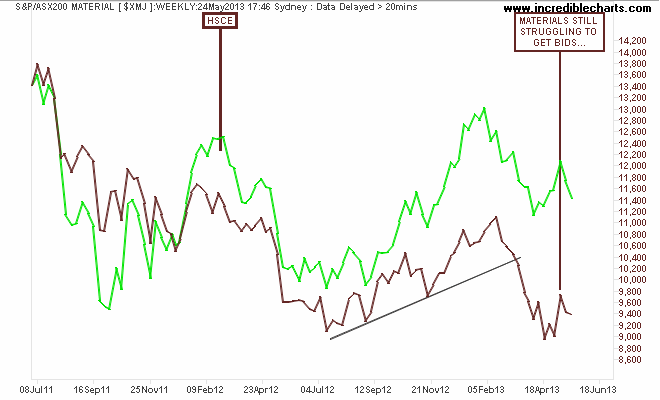
As I said previously, for a possible leading index for the Materials index, watch the Hang Seng China Enterprises (HSCE) Index, which had been starting to recover but is waning on the back of the poor China PMI result and volatility in the turbo-charged Japanese stock market:
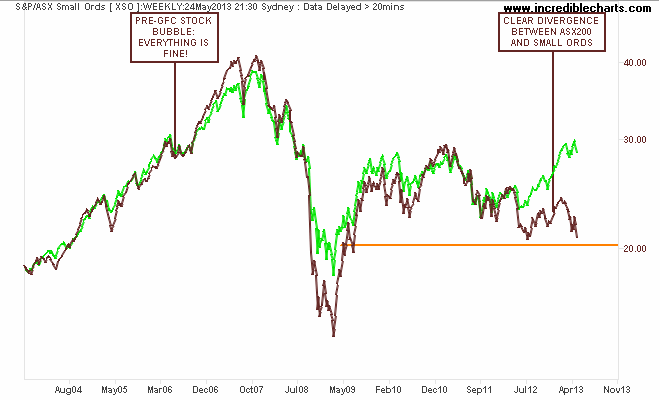
Another piece of evidence to show how narrow this rally is is the backbone of the ASX200 – the Small Ords Index (XSO) – those small cap stocks outside the top ASX100, but within the ASX300. It is from here that you get your next Fortescues and Cochlears…Now at a three year low:
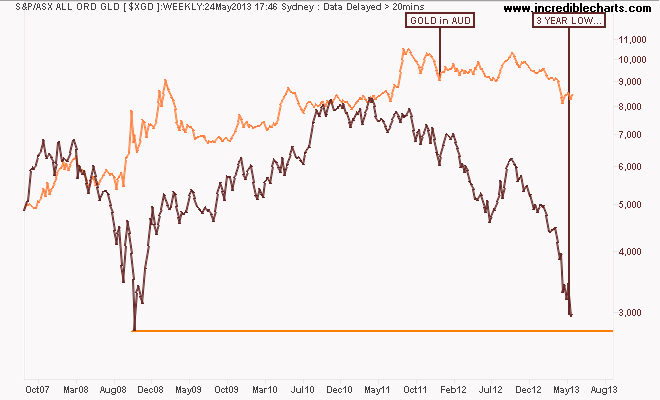
And finally, a glinter of hope or just fools gold? The ASX Gold Index (XGD – mainly Newcrest (NCM) and Kingsgate (KCN)) – has taken an absolute whopping in recent times, but was the only sector to get a bid on Friday (up 3%). Before you join the phsyical buyers of gold and rush out to grab some extremely oversold gold miners, be careful you’re not catching knives here. The gold price, as measured in AUD, has not fallen a lot – relatively – and could have more to go, pinning these miners to the wall:
Trading Diary
If you’re interested in my infrequent and irregular thoughts about trading (mainly Aussie shares), markets and subjects like risk and psychology, have a look at my Trading Diary.
Remember to manage your risk first and the returns should come thereafter. Have a good weekend!