
Perhaps this is due to a search for yield. Perhaps it is foreign cash seeking a safe harbour. Or perhaps it’s simply time for the Aussie love affair to be rekindled. Holes are over. It’s houses turn.
Despite first home buyers being tapped out, having dosed up in property during the 2008-09 FHBG boost period, the critical indicators are showing that the slow melt of Australian property has run most of its course.
With these winds of change in the air maybe it is time to take a step back and look at the long term property cycle itself. This post is, therefore, my attempt to interpret our point in the residential price cycle based on key pattern that have repeated in previous cycles.
For economists, long term regularity of asset price cycles is an intriguing proposition. Is the 18 year cycle really a good rule of thumb? If so, why don’t investors rationally expect the cycle, and remove it through their anticipatory actions?
One simple answer might be that investors would anticipate the cycle if credit markets would allow it. But the banks supplying of credit are themselves constrained by previous movements of the market. Thus the interaction of prices and the willingness to supply credit seems to be pretty decent explanation of the peculiar regularity of long term cycles. Thanks Minksy.
My preferred way to think about the nature of the cycle is in terms of returns from yield compared to capital growth. At the bottom of the cycle equities, including property, are seen as risky places to preserve capital. During the boom expectations of capital growth return, and equities become the assets to hold despite low yields.
In the past I have used the mortgage rate divided by gross yield as a measure of the relative value of residential property. The theoretical picture is that the mortgage rate is a good proxy for the yields, net of capital growth, available in the economy generally. Gains above this rate typically arise from capital gains.
So where’s my evidence for the usefulness of this measure? The graph below is an update from a previous post. With rental growth, falling prices, and falling interest rates for the past five years, this simple measure is showing that now is a good time to buy.
I have also created a second measure – the mortgage payment per dollar of a 30 year loan divided by the yield. The second measure adjusts for the fact that the cost of buying asset, in addition to the cost of interest, is a higher portion of the total cost at lower interest rates.
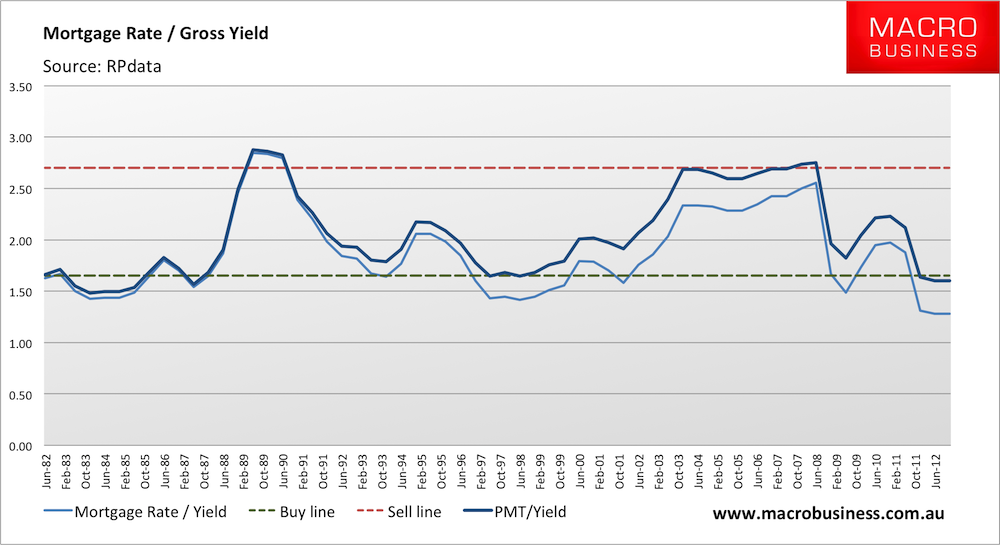
These is a surprising regularity of a head and shoulders-type pattern – similar tops and bottoms, and a similar period to the cycle, in this case 16 years. Not too far from the 18 year rule of thumb. And not too far off the stylised asset price cycle seen so regularly when discussing the latest housing boom.
This aggregated view can be somewhat deceiving since Australian capital city markets do not move in synch. Sydney and Melbourne have typically led the cycle, with Adelaide, Brisbane and Perth a few years behind. Details of this pattern are here. Some capital city markets and many regional markets might have a lot of melting still to do.
Other indicators also point to Australia being nearing the bottom of the price cycle on average, with probably just 2-3 years more to run.
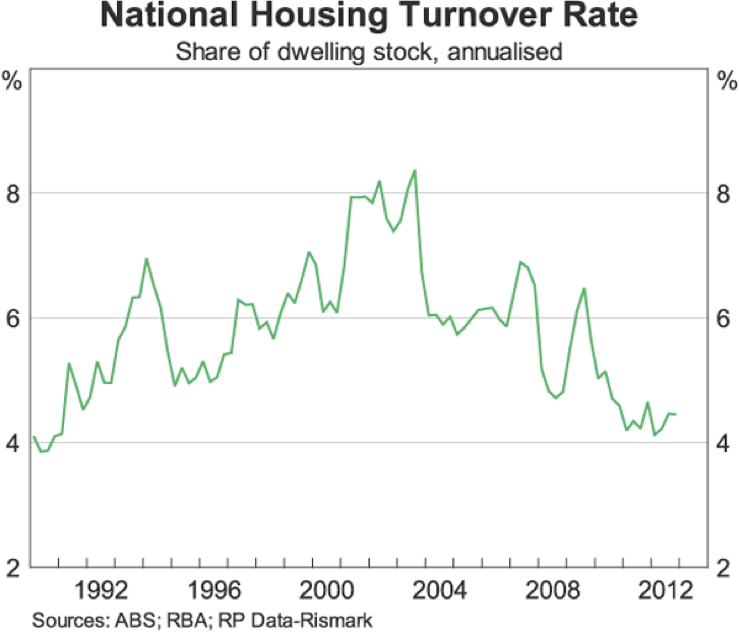
First, dwelling turnover is at multi-decade lows. We have bobbed along the bottom for three years now. What is crucial here is that the price cycle usually involves increasing turnover, and higher turnover is more likely than lower from this point forward.
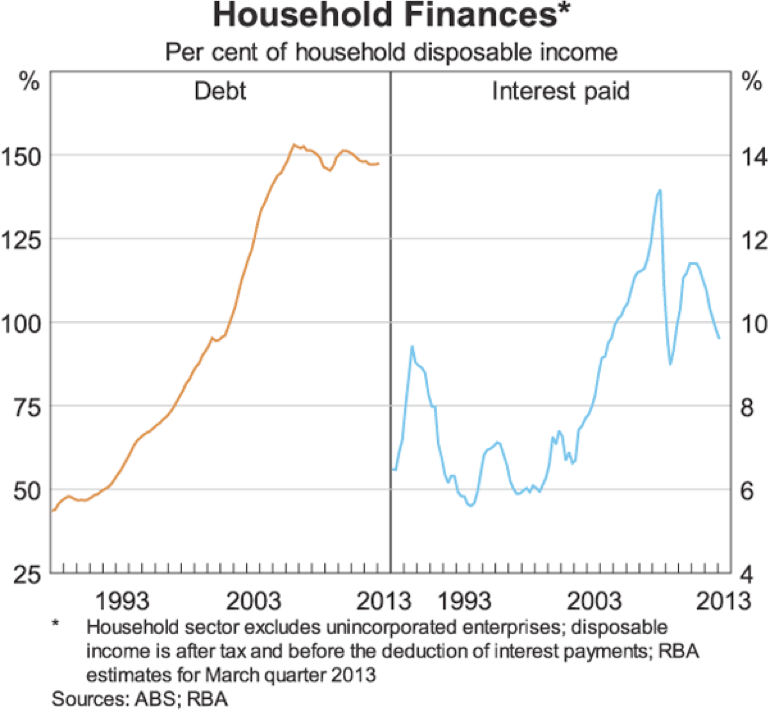
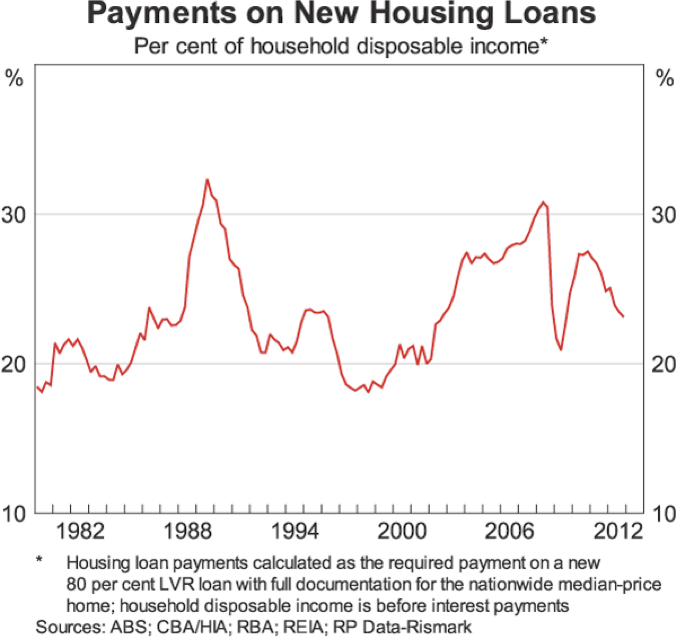
Second, mortgage payments to household incomes should be returning to historical lows. The two below charts from the RBA cement the idea that the relative affordability of home buying the highest it has been since 2000.
After last month’s interest rate cut, and more expected this year, interest paid as a share of household income should fall quickly below 8% in the next two years.
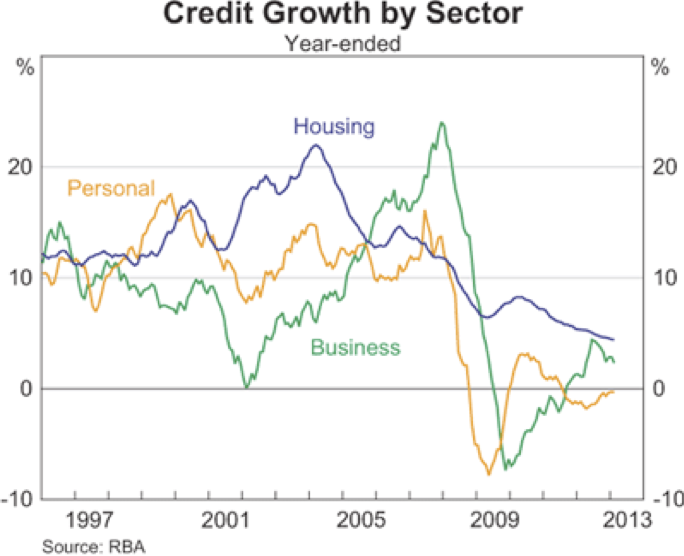
Third, housing credit growth has been on the decline since the end of the national boom in 2003. However the short periods of increasing rates of growth also produced price gains. It’s now been ten years since this peak, and a modest turn around looks imminent, especially considering the pattern of the second derivative of housing credit which is surging towards positive territory.
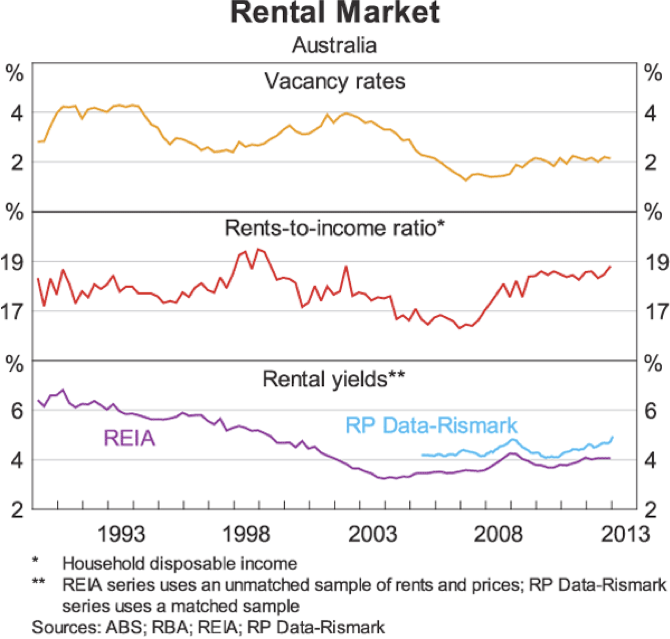
Lastly, falling rents are a signature of periods of increasing prices. As I wrote two years ago, the next rental price cycle would be accompanied by falling prices. Which is exactly what has happened since the financial crisis. This might be over for now.
There are essentially two ways to read these pattern in the data.
1. A renewed cycle
A great time to buy in most capital cities was around 1998. This year preceded a boom in Sydney, that cascaded across the country for the next 8 years. My charts show the cycle at around 16 years, meaning 2014 is predicted to be a good time to buy. The 18 year rule of thumb is then 2016 – just three years time.
Given the expected resources shock in the second half of this year and early next, I would not be in a rush. Also it may be wise to get better signals about the direction of international markets, particularly the US before leveraging into Australian housing. 2015-16 is looking to be a relatively good time to buy if you are confident of another cycle.
Just remember, the bottom of the cycle typically coincides with slow economic periods and high unemployment, and it is exactly these factors that will keep prices down for the next couple of years.
2. A long stagnation
Given the weight of private debt, the already low interest rates across most of the developed economies, and a general reluctance for increased public spending to maintain employment and stimulate private investment, could we be heading to a long credit-constrained stagnation that requires major price adjustments in wages, rents, and currencies? The Japanese experience may be telling.
My personal view is actually a blend of these options.
I do think that the bottom of the property price cycle is now just a couple of years away. But there are many reasons to think that in the next boom prices will be far more contained.
- A psychological factor to consider is the relatively smooth economic performance experienced in Australia since the financial crisis. Perhaps this will mean people will be more willing to borrow, and bank more willing to lend. Or perhaps the memory and lessons from abroad might keep the next credit boom in check. I tend towards lessons learnt and more conservative lending. However, we still need to consider that mortgage interest rates are likely to fall another 0.5% from this point over the net two years.
- A slowdown in foreign demand. If the safe harbour of the AUD is no longer seen as necessary, this may slow demand for AUD assets.
- Demographic headwinds, with asset rich baby-boomer looking to cash in to fund retirement.
- Lower inflation generally due to constrained more credit.
- RBA now actively monitoring home prices and the threat of precautionary monetary policy tightening
The crucial lesson in all this is that Australian nominal asset prices have been supported by fiscal policy during the financial crisis, ongoing monetary policy adjustments, and foreign investment (including in mining infrastructure), which all supported employment and incomes.
This support allowed a slow melt adjustment since the financial crisis. Home prices have fallen, mortgage rates are down, and rents have increased. This means that buying a home is more affordable compared to renting than it has been for 15 years.
My message, if it wasn’t clear, is that if you have been holding off purchasing a home because of the risk of capital losses, then these risks are probably lower now than at any time in the past decade. Maybe prices will be a couple of percent lower at the end of next year, but I have a hard time wrapping my mind around downward price movement more severe than a couple more years of the slow melt, or around 3% in nominal terms. The chances of price gains is also now much higher.
Unfortunately this coming 2 year period is also likely to be economically unstable, with low wage growth and a fragile labour market. That is the catch with trying to time the residential property cycle – it is a game for players with lots of capital.
Now don’t take this as a thumbs up from me for housing price growth. High asset prices are not a particularly desirable feature of an economy. However my strongly held view is that asset prices should not form part of the debate over housing affordability. It is like having a debate over the affordability if steel by looking at the price of BHP shares. No, the asset price will be subject to the whims of financial markets, and the affordability of steel can only be observed by looking at the price of steel. In housing markets, land prices are asset price, and rental prices are the actual market price for housing. And I am glad to see that rents now appear to be falling again.
Please share this article. Tips, suggestions, comments and requests to rumplestatskin@gmail.com + follow me on Twitter @rumplestatskin