
A fascinating long term study by EconomPic, building on a similar study done by The Big Picture on the seasonality of investing in US equities. The old adage, “sell in May and go away (until November)” seems to have empirical validity. Look below for my study on Australian stock prices.
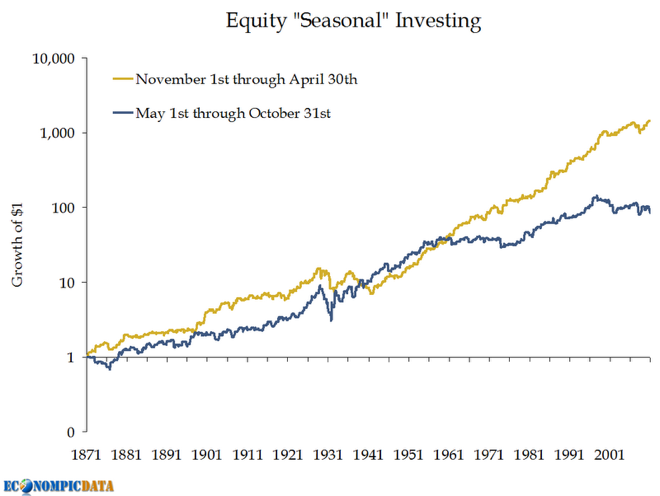
Using S&P data from Professor Shiller’s Irrational Exuberance site, I constructed the below chart going all the way back to 1871. The outperformance of the November – April time frame since 1959 can be seen, but interestingly enough before that date both periods had almost the exact same performance.
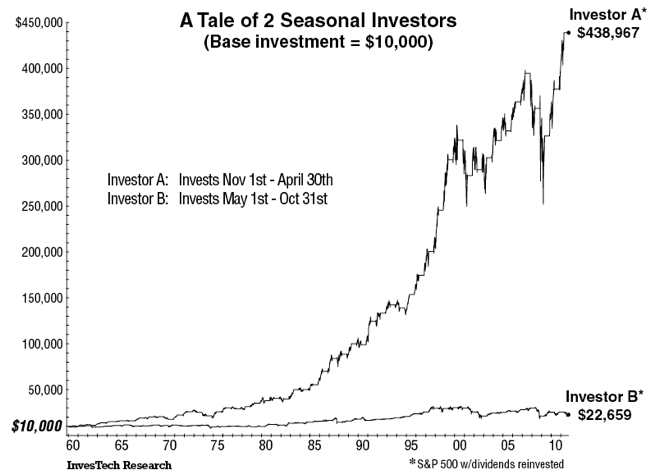
Here’s the Big Picture chart, for the 1959 to 2011 timeframe only:
I’ve constructed a similar study, using monthly All Ordinaries data going back to 1875 with similar results:
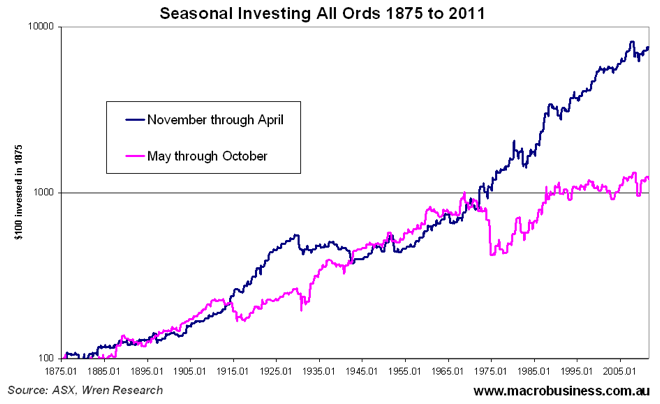
Several points stand out:
- From 1875 to WW1 (which included both bull and bear markets), the strategies produced similar results
- In the latter stages of the secular bull market from WW1 through to the 1929 crash, the Sell in May strategy outperformed
- In the aftermath, the Buy in May strategy was the winner, picking the lows of the Great Depression, with the Sell in May portfolio requiring 30 years to make any gains!
- During the last secular bear market (1969 to 1982) the Buy in May strategy was a very poor performer with huge equity drawdowns, due to exposure to only a few bad months of market falls
- In the latest secular bull market (1982 to 2007), the Sell in May strategy, outperformed the Buy in May 3 to 1
- Since the GFC, the Sell in May strategy has had a slightly lower drawdown from a higher peak (23% vs 27%) but current values are similar
It appears that in secular bull markets, the Sell in May strategy is the clear seasonal winner, whilst in secular bear markets, the results are ambiguous but seem to point to the Sell in May strategy in recent history.
So there does appear to be a seasonal bias towards equities for Australian stocks, which invariably follow the US. Different theories have been put forward, namely the propensity for US investors to sell down their portfolios coming into the northern hemisphere summer and an uptick in the economic cycle coming into the Christmas retail period and the spring harvest.
But the most interesting results of these studies? A straight buy and hold strategy from January 1875 and held through to July 2011, would have outperformed the Sell in May strategy by more than 9 times.
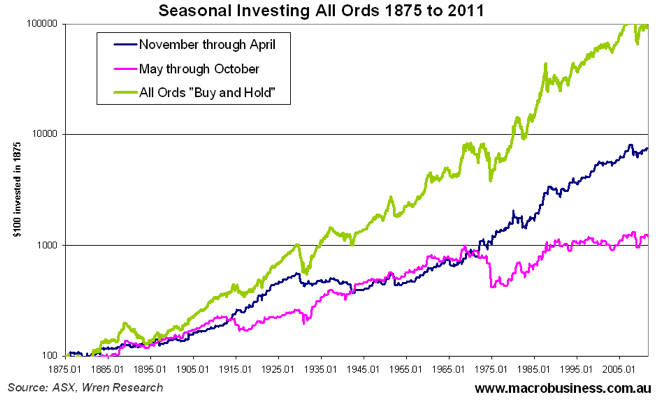
There is a huge survivorship bias of this comparison which assumes you bought an index that initially comprised companies selling buggy wheels, sheep shearing handtools and tophats, whilst the the timing strategy would involve buying the top stocks of the day, which is a more realistic scenario (although the recent advent of Exchange Traded Funds (ETF) with automatic rebalancing has made this easier)
Further, the problem with averages raises its ugly head as you are exposed to every market crash and correction along the way. The Sell in May strategy limits monthly drawdowns to 13%, whilst the Buy in May and Buy and Hold have maximum drawdowns of 19% and 32% respectively. Although time can heal these “wounds”, it may require a longer period than an investor can endure with a heady reliance upon dividends.
Implications for medium to long term investors? If you wish to hold your portfolio, it may pay to purchase protection each year after May (e.g a December dated index put option) and increase leverage and/or buy on the dips during the November to April “ebullient” period.
This warrants further study particularly when combined with other hedging and timing strategies, which I’ll cover in future special reports.
Note: the Sell in May, Buy in May and Buy and Hold average monthly returns were 0.7%, 0.43% and 0.48% respectively.